HKO enhances its meteorological satellite imagery services
23 June 2026
The Observatory enhances its meteorological satellite imagery services. “Sulfur Dioxide” satellite imagery (Figure 1) based on Himawari geostationary satellite of Japan Meteorological Agency is released today (23 June 2026). The imagery highlights the distribution of sulfur dioxide in the atmosphere using a special colour scheme, enabling users to observe the distribution and dispersion of the volcanic ash and gases containing sulfur dioxide released from volcanic eruptions over the Eastern Asia. Besides, the polar-orbiting satellite imageries have been updated, including true colour imagery (Figure 2), aerosol optical depth imagery (Figure 3) and sea surface temperature imagery (Figure 4). Update frequency of each imagery is also increased, from weekly to daily for the sea surface temperature imagery, and even three to four times daily for the true colour and aerosol optical depth imageries.
The latest meteorological satellite imageries and products can be viewed at the following link:
https://www.hko.gov.hk/en/wxinfo/intersat/satellite/sate.htm
For more information about the monitoring on volcano activity using meteorological satellites, you may refer to the following popular science article:
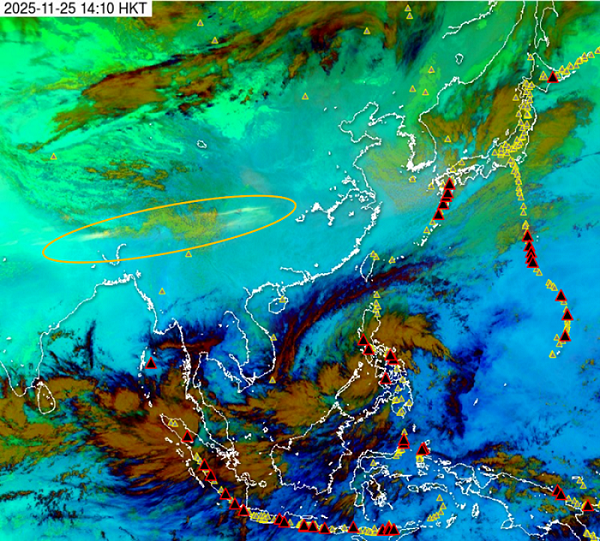
Fig. 1 “Sulfur Dioxide” satellite image at around 2 p.m. on 25 November 2025. The volcanic ash and gases, released from the eruption of Hayli Gubbi volcano in Ethiopia, Africa, on 23th of the same month, drifted eastward with upper-air westerly winds across the skies above northern India, central China, and southern Japan in the following few days. The volcanic ash and gases appear in “Sulfur Dioxide” image as a narrow and generally east-west oriented band in pale yellow colour (marked by the orange-yellow ellipse). The triangles in the image indicate the locations of known volcanoes. To highlight the relatively thin traces of sulfur dioxide, all the clouds in the image are shown in darker colours.
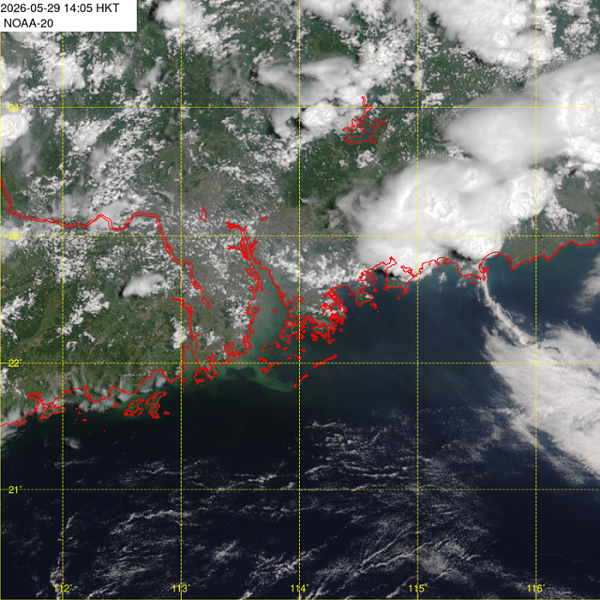
Fig. 2 True Colour image based on the data from Joint Polar Satellite System (JPSS) of the U.S. National Oceanic and Atmospheric Administration (NOAA) helps monitor the change of clouds over Hong Kong and its adjacent region.
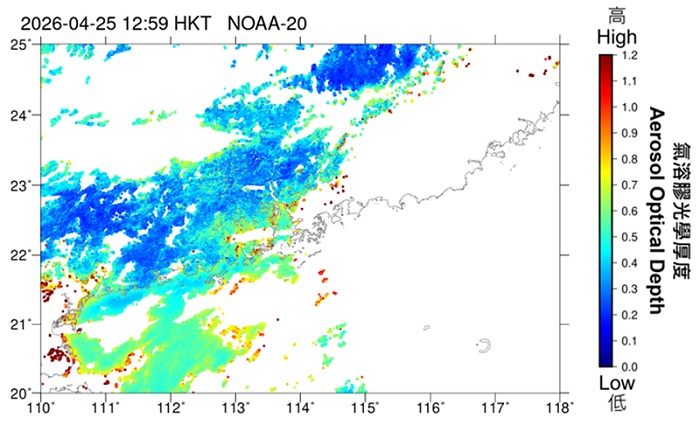
Fig. 3 Aerosol optical depth image based on the data from JPSS of the U.S. NOAA helps monitor the change of atmospheric visibility and the distribution of suspended particles in the air over Hong Kong and its adjacent region.
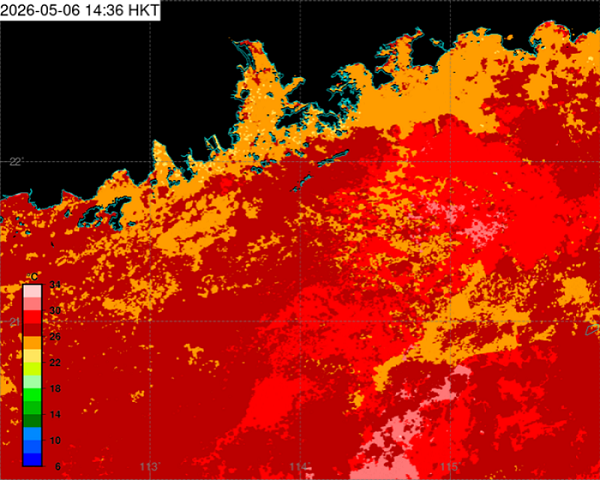
Fig. 4 Sea surface temperature image based on the JPSS of the U.S. NOAA helps monitor the change of water temperature over Hong Kong and its adjacent waters.