Monthly Meteorological Normals for Hong Kong
- Monthly mean numbers of days with tropical cyclone warning signals and Strong Monsoon Signal in Hong Kong between 1961-1990
- Monthly mean of rainfall in Hong Kong between 1961-1990
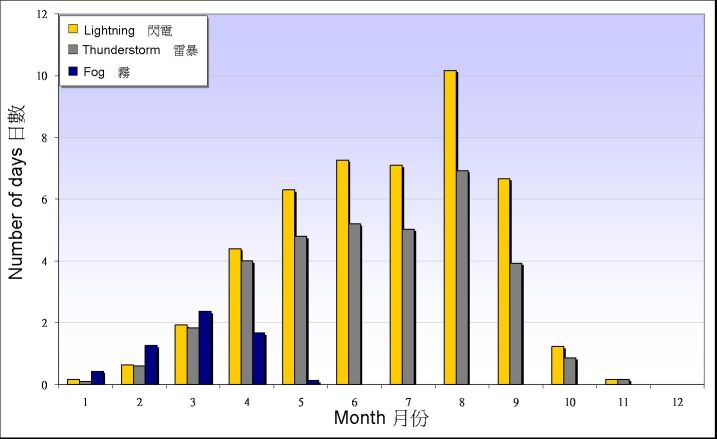
- Monthly mean numbers of days with lightning, thunderstorm and fog reported at the Observatory between 1961-1990
- Monthly means of daily maximum, mean and minimum temperature recorded at the Observatory between 1961-1990
- Monthly means of relative humidity, dew point temperature, wet-bulb temperature and vapour pressure recorded at the Observatory between 1961-1990
- Monthly means of cloud amount observed at the Observatory and sunshine duration and daily global solar radiation recorded at King's Park between 1961-1990
- Monthly means of prevailing wind direction and mean wind speed recorded at the Observatory and Waglan Island between 1961-1990
- Monthly mean of atmospheric pressure recorded at the Observatory between 1961-1990
- Monthly means of sea surface temperature recorded at North Point and Waglan Island, and evaporation and potential evapotranspiration recorded at King's Park between 1961-1990
- Monthly mean of soil temperature recorded at the Observatory between 1967-1996
 Month |
Number of Days with Tropical Cyclone Warning Signal |
Number of Days with Strong Monsoon Signal |
|||
|---|---|---|---|---|---|
No. 1 and/or higher |
No. 3 and/or higher |
No. 8 and/or higher |
No. 9 and/or No. 10 |
||
| January | - | - | - | - | 2.77 |
| February | - | - | - | - | 3.17 |
| March | - | - | - | - | 2.60 |
| April | 0.17 | - | - | - | 2.37 |
| May | 0.70 | 0.50 | 0.13 | 0.03 | 1.13 |
| June | 1.97 | 0.93 | 0.13 | - | 0.93 |
| July | 4.57 | 2.93 | 0.67 | 0.07 | 0.30 |
| August | 3.33 | 1.70 | 0.53 | 0.17 | 0.17 |
| September | 4.50 | 2.50 | 0.57 | 0.10 | 1.17 |
| October | 3.37 | 2.40 | 0.30 | 0.10 | 3.80 |
| November | 0.50 | 0.30 | 0.07 | - | 3.27 |
| December | 0.07 | 0.07 | - | - | 3.97 |
| Year | 19.17 | 11.33 | 2.40 | 0.47 | 25.63 |
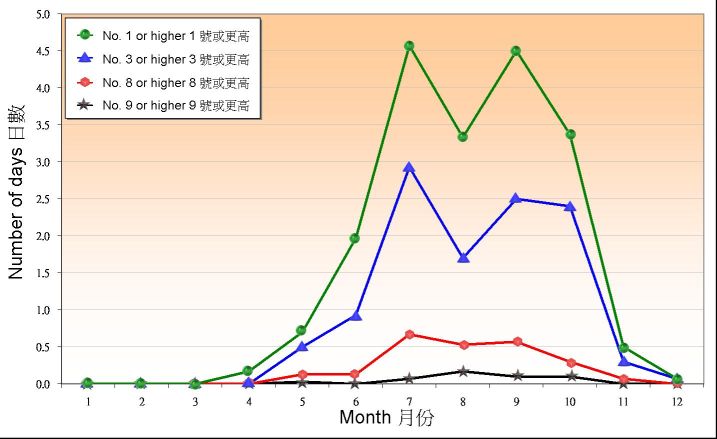
Figure 1.1. Monthly mean number of days with tropical cyclone warning signals in Hong Kong between 1961-1990
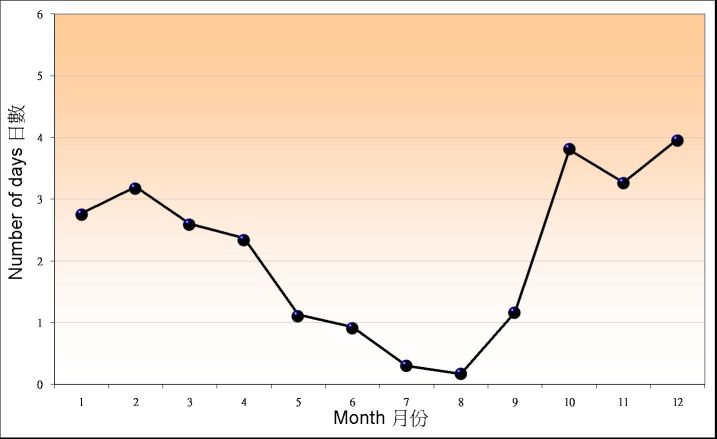
Figure 1.2. Monthly mean number of days with Strong Monsoon Signal in Hong Kong between 1961-1990
Month |
Total (mm) |
Duration (hours) |
Number of Days with | ||
|---|---|---|---|---|---|
0.1 mm or more |
25 mm or more |
50 mm or more |
|||
| January | 23.4 | 41 | 5.63 | 0.10 | 0.00 |
| February | 48.0 | 69 | 8.93 | 0.43 | 0.03 |
| March | 66.9 | 89 | 10.07 | 0.60 | 0.27 |
| April | 161.5 | 82 | 11.13 | 2.20 | 0.97 |
| May | 316.7 | 92 | 14.93 | 3.40 | 1.93 |
| June | 376.0 | 86 | 19.23 | 4.23 | 1.97 |
| July | 323.5 | 67 | 17.47 | 3.93 | 1.97 |
| August | 391.4 | 73 | 17.30 | 4.70 | 2.17 |
| September | 299.7 | 68 | 14.37 | 3.57 | 1.63 |
| October | 144.8 | 48 | 8.60 | 1.50 | 0.87 |
| November | 35.1 | 37 | 5.87 | 0.40 | 0.10 |
| December | 27.3 | 31 | 3.87 | 0.23 | 0.10 |
| Year | 2214.3 | 782 | 137.40 | 25.30 | 12.00 |
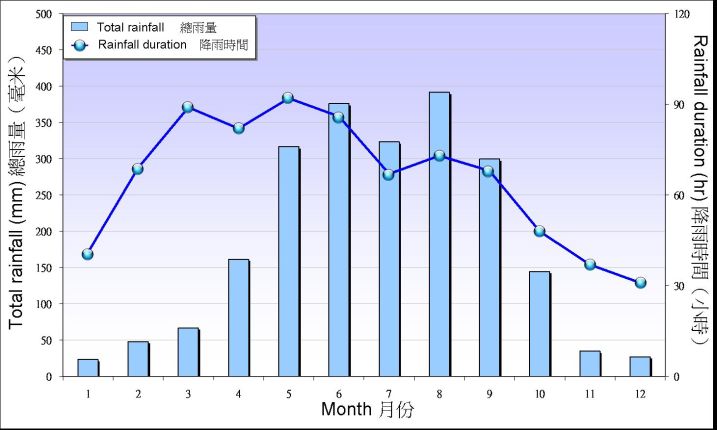
Figure 2. Monthly mean of rainfall in Hong Kong between 1961-1990
Month |
Number of Days with Lightning |
Number of Days with Thunderstorm |
Number of Days with Fog (Visibility < 1000 m) |
|---|---|---|---|
| January | 0.17 | 0.10 | 0.43 |
| February | 0.63 | 0.60 | 1.27 |
| March | 1.93 | 1.83 | 2.37 |
| April | 4.40 | 4.00 | 1.67 |
| May | 6.30 | 4.80 | 0.13 |
| June | 7.27 | 5.20 | - |
| July | 7.10 | 5.03 | - |
| August | 10.17 | 6.93 | - |
| September | 6.67 | 3.93 | - |
| October | 1.23 | 0.87 | - |
| November | 0.17 | 0.17 | - |
| December | - | - | - |
| Year | 46.03 | 33.47 | 5.87 |
Month |
Mean Daily Maximum (deg. C) |
Mean (deg. C) |
Mean Daily Minimum (deg. C) |
|---|---|---|---|
| January | 18.6 | 15.8 | 13.6 |
| February | 18.6 | 15.9 | 13.9 |
| March | 21.3 | 18.5 | 16.5 |
| April | 24.9 | 22.2 | 20.2 |
| May | 28.7 | 25.9 | 23.9 |
| June | 30.3 | 27.8 | 25.9 |
| July | 31.5 | 28.8 | 26.6 |
| August | 31.3 | 28.4 | 26.3 |
| September | 30.3 | 27.6 | 25.5 |
| October | 27.9 | 25.2 | 23.1 |
| November | 24.2 | 21.4 | 19.2 |
| December | 20.5 | 17.6 | 15.4 |
| Year | 25.7 | 23.0 | 20.9 |
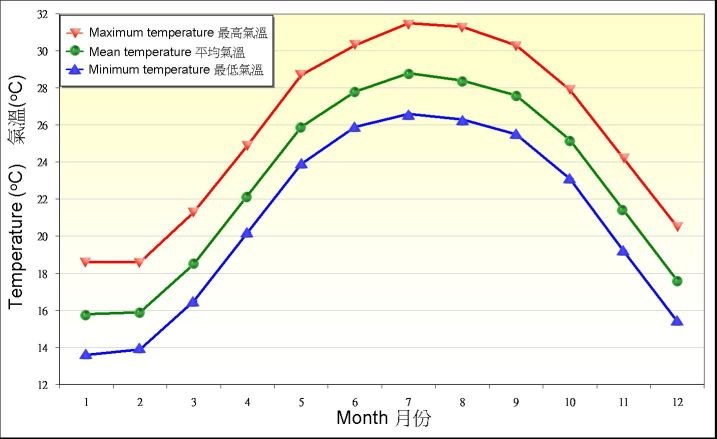
Figure 4. Monthly means of daily maximum, mean and minimum temperature recorded at the Observatory between 1961-1990
Month |
Relative Humidity (%) | Dew Point Temperature (deg. C) |
Wet-bulb Temperature (deg. C) |
Vapour Pressure (hPa) |
||
|---|---|---|---|---|---|---|
| Mean | Mean at 0200 hours |
Mean at 1400 hours |
||||
| January | 71 | 76 | 62 | 10.2 | 13.0 | 13.1 |
| February | 78 | 82 | 70 | 11.8 | 13.8 | 14.5 |
| March | 81 | 85 | 73 | 15.0 | 16.5 | 17.6 |
| April | 83 | 88 | 75 | 19.0 | 20.2 | 22.4 |
| May | 83 | 87 | 76 | 22.6 | 23.7 | 27.7 |
| June | 82 | 86 | 76 | 24.4 | 25.4 | 30.7 |
| July | 80 | 85 | 73 | 24.9 | 26.0 | 31.6 |
| August | 81 | 86 | 74 | 24.8 | 25.9 | 31.4 |
| September | 78 | 83 | 71 | 23.3 | 24.6 | 28.8 |
| October | 73 | 78 | 66 | 19.8 | 21.8 | 23.6 |
| November | 69 | 74 | 61 | 15.2 | 17.9 | 18.0 |
| December | 68 | 73 | 59 | 11.2 | 14.3 | 14.1 |
| Year | 77 | 82 | 70 | 18.6 | 20.3 | 22.8 |
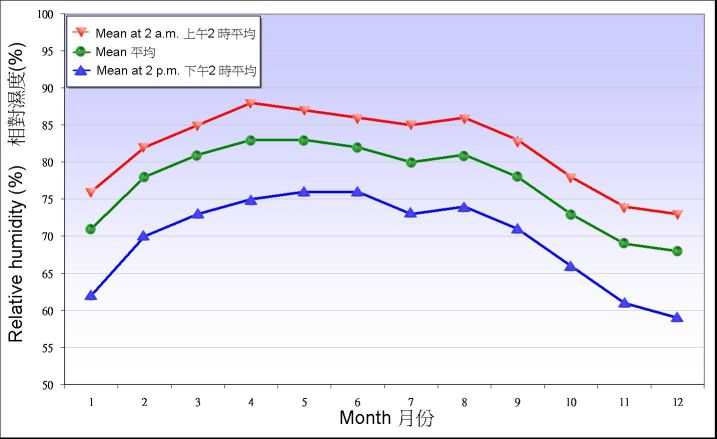
Figure 5.1. Monthly mean of relative humidity recorded at the Observatory between 1961-1990
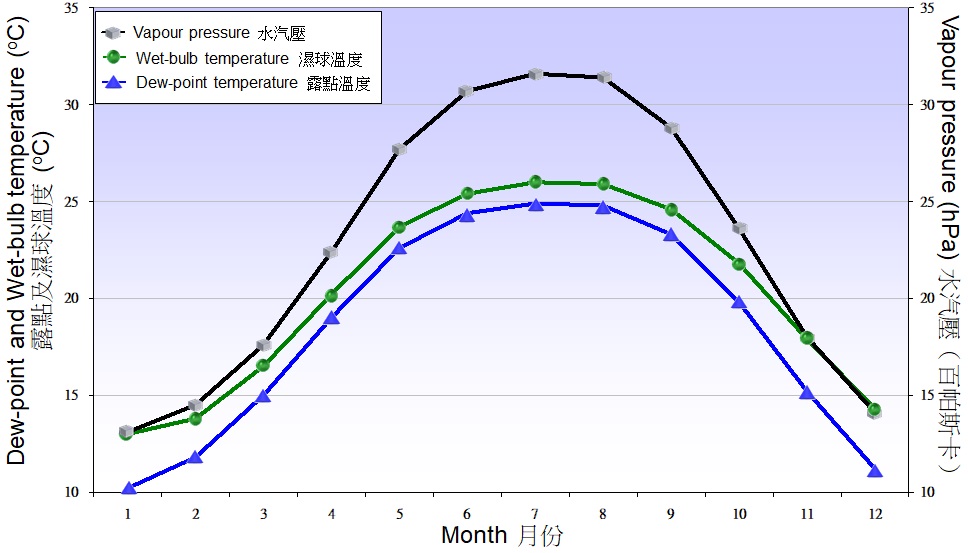
Figure 5.2. Monthly means of dew point temperature, web-bulb temperature and vapour pressure recorded at the Observatory between 1961-1990
Month |
Cloud Amount (%) |
Bright Sunshine | Daily Global Solar Radiation (MJ/m2) |
|
|---|---|---|---|---|
Duration (hours) |
Percentage of Possible |
|||
| January | 58 | 152.4 | 45 | 11.63 |
| February | 73 | 97.7 | 30 | 10.69 |
| March | 76 | 96.4 | 26 | 11.24 |
| April | 78 | 108.9 | 29 | 13.14 |
| May | 74 | 153.8 | 38 | 16.12 |
| June | 75 | 161.1 | 40 | 16.55 |
| July | 65 | 231.1 | 56 | 19.15 |
| August | 66 | 207.0 | 52 | 17.61 |
| September | 63 | 181.7 | 49 | 16.49 |
| October | 56 | 195.0 | 54 | 15.46 |
| November | 53 | 181.5 | 55 | 13.39 |
| December | 49 | 181.5 | 54 | 12.03 |
| Year | 65 | 1948.1 | 44 | 14.46 |
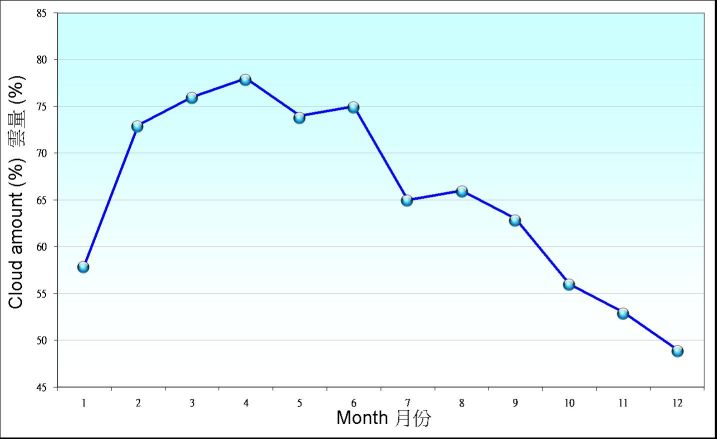
Figure 6.1. Monthly mean of cloud amount recorded at the Observatory between 1961-1990
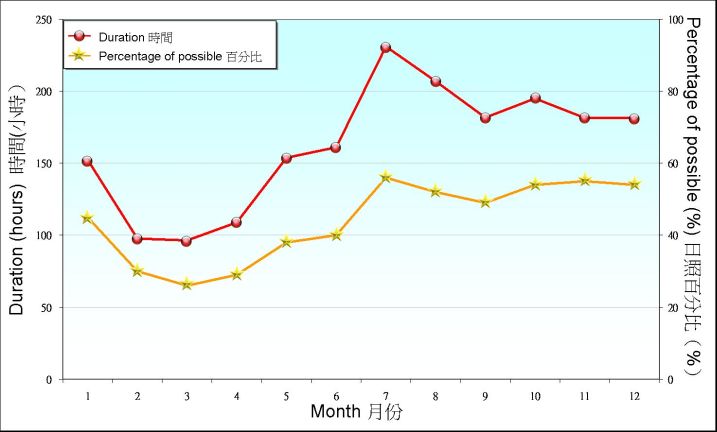
Figure 6.2. Monthly mean of sunshine duration recorded at King's Park between 1961-1990
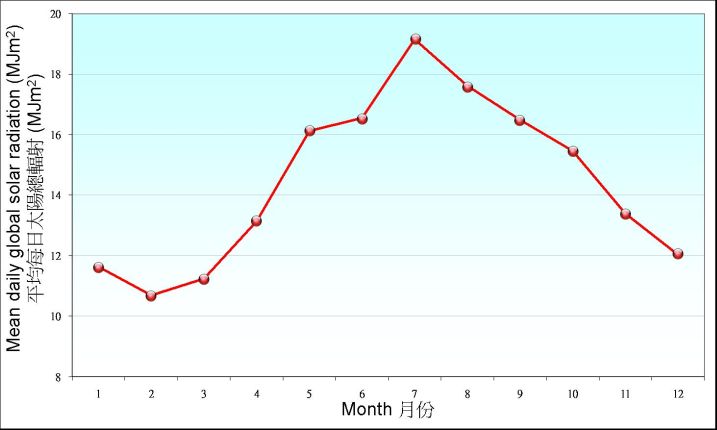
Figure 6.3. Monthly mean of daily global solar radiation recorded at King's Park between 1961-1990
Month |
Observatory | Waglan Island | ||
|---|---|---|---|---|
Prevailing Direction (deg.) |
Mean Wind Speed (km/h) |
Prevailing Direction (deg.) |
Mean Wind Speed (km/h) |
|
| January | 090 | 11.2 | 070 | 24.0 |
| February | 090 | 11.9 | 070 | 23.8 |
| March | 090 | 12.6 | 070 | 22.1 |
| April | 090 | 11.7 | 080 | 19.7 |
| May | 090 | 10.6 | 090 | 19.2 |
| June | 090 | 10.4 | 090 | 21.6 |
| July | 260 | 10.1 | 230 | 20.0 |
| August | 090 | 9.4 | 090 | 18.5 |
| September | 090 | 10.7 | 090 | 21.9 |
| October | 090 | 12.2 | 090 | 27.6 |
| November | 090 | 11.0 | 080 | 27.2 |
| December | 090 | 10.5 | 080 | 25.5 |
| Year | 090 | 11.0 | 080 | 22.6 |
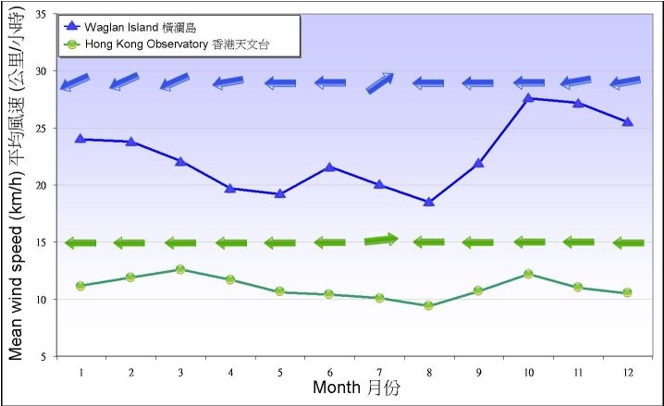
Figure 7. Monthly means of prevailing wind direction and mean wind speed recorded at the Observatory and Waglan Island between 1961-1990
Month |
Mean (hPa) |
Mean Diurnal Range (hPa) |
|---|---|---|
| January | 1020.2 | 4.1 |
| February | 1018.7 | 4.1 |
| March | 1016.2 | 4.2 |
| April | 1013.1 | 3.8 |
| May | 1009.1 | 3.4 |
| June | 1006.0 | 3.0 |
| July | 1005.3 | 3.4 |
| August | 1005.1 | 3.5 |
| September | 1008.8 | 3.6 |
| October | 1014.0 | 3.6 |
| November | 1017.9 | 3.8 |
| December | 1020.2 | 4.0 |
| Year | 1012.9 | 3.7 |
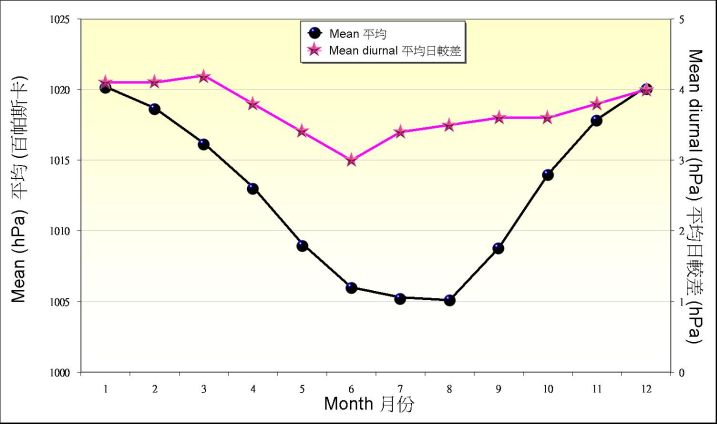
Figure8. Monthly mean of atmospheric pressure recorded at the Observatory between 1961-1990
Month |
Sea Surface Temperature (deg. C) | Evaporation (mm) |
Potential Evapotranspiration (mm) |
|||
|---|---|---|---|---|---|---|
| North Point * | Waglan Island | |||||
| 0700 hours | 1400 hours | 0700 or 1100 hours |
1400 or 1700 hours |
|||
| January | 17.5 | 17.7 | 17.1 | 17.3 | 97.5 | 73.2 |
| February | 16.7 | 17.0 | 16.3 | 16.4 | 79.0 | 66.3 |
| March | 17.9 | 18.2 | 17.3 | 17.5 | 92.2 | 77.0 |
| April | 20.9 | 21.3 | 20.3 | 20.5 | 106.9 | 92.0 |
| May | 24.5 | 25.0 | 24.5 | 24.8 | 137.7 | 115.0 |
| June | 26.5 | 26.9 | 26.6 | 26.9 | 143.9 | 126.6 |
| July | 26.6 | 27.1 | 27.4 | 27.7 | 171.6 | 150.5 |
| August | 26.5 | 27.0 | 27.3 | 27.6 | 156.9 | 135.8 |
| September | 27.1 | 27.5 | 27.4 | 27.7 | 150.3 | 120.6 |
| October | 26.3 | 26.6 | 26.3 | 26.5 | 152.2 | 112.8 |
| November | 23.4 | 23.6 | 23.4 | 23.5 | 129.1 | 88.8 |
| December | 19.8 | 20.0 | 19.5 | 19.7 | 111.5 | 76.7 |
| Year | 22.8 | 23.2 | 22.8 | 23.0 | 1528.8 | 1235.0 |
* 1975 - 2004
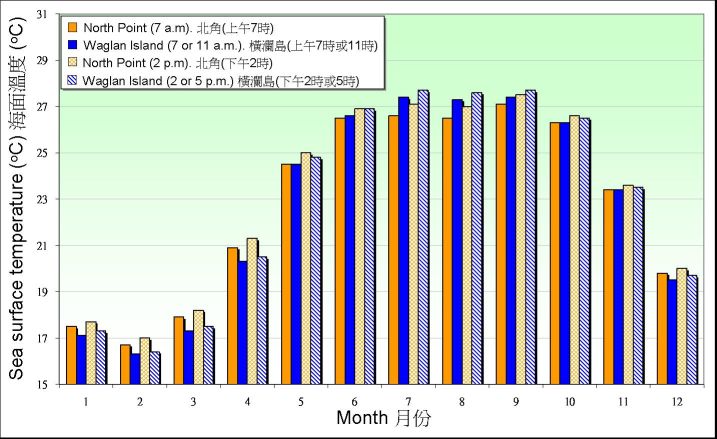
Figure9.1. Monthly means of sea surface temperature recorded at North Point between 1975-2004 and Waglan Island between 1961-1990
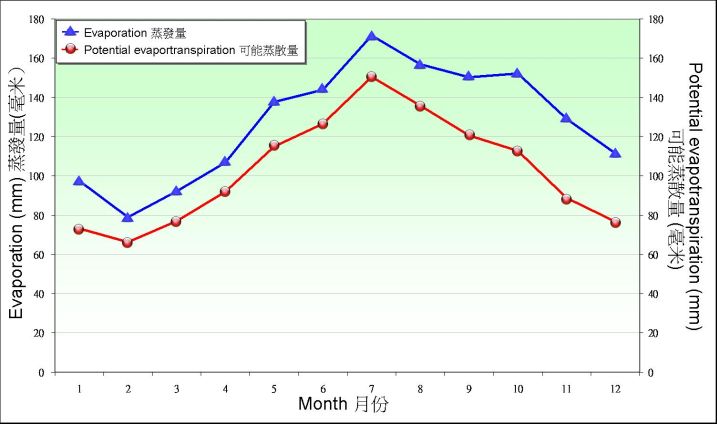
Figure9.2. Monthly means of evaporation and potential evapotranspiration recorded at King's Park between 1961-1990
Month |
0.5 m | 1.0 m | 1.5 m | |||
|---|---|---|---|---|---|---|
| 0700 hours (deg. C) |
1900 hours (deg. C) |
0700 hours (deg. C) |
1900 hours (deg. C) |
0700 hours (deg. C) |
1900 hours (deg. C) |
|
| January | 18.9 | 18.9 | 20.5 | 20.6 | 21.7 | 21.7 |
| February | 18.8 | 18.9 | 19.9 | 20.0 | 20.9 | 20.9 |
| March | 20.4 | 20.5 | 20.7 | 20.7 | 21.1 | 21.1 |
| April | 23.1 | 23.3 | 22.6 | 22.6 | 22.4 | 22.4 |
| May | 26.5 | 26.7 | 25.5 | 25.5 | 24.8 | 24.8 |
| June | 28.4 | 28.6 | 27.5 | 27.6 | 26.8 | 26.8 |
| July | 29.9 | 30.0 | 29.0 | 29.1 | 28.3 | 28.3 |
| August | 30.0 | 30.1 | 29.5 | 29.5 | 29.0 | 29.0 |
| September | 29.6 | 29.7 | 29.4 | 29.4 | 29.1 | 29.1 |
| October | 27.6 | 27.6 | 28.1 | 28.1 | 28.2 | 28.2 |
| November | 24.4 | 24.4 | 25.7 | 25.6 | 26.4 | 26.3 |
| December | 20.6 | 20.6 | 22.5 | 22.5 | 23.7 | 23.7 |
| Year | 24.9 | 24.9 | 25.1 | 25.1 | 25.2 | 25.2 |
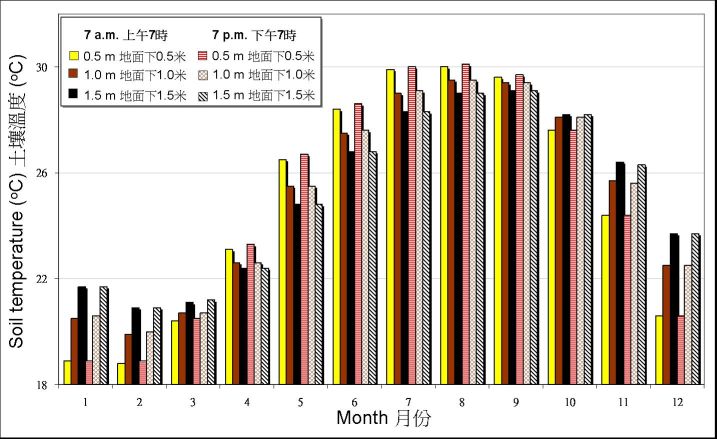
Figure10. Monthly mean of soil temperature recorded at the Observatory between 1967-1996