10-Day normals of Air Temperature and Rainfall recorded at the Hong Kong Observatory, 1971-2000
| Date | Air Temperature Figure |
Mean Total Rainfall (mm) Figure |
||
|---|---|---|---|---|
| Mean Maximum (deg.C) |
Mean (deg.C) |
Mean Minimum (deg.C) |
||
| Jan 01-10 | 19.2 | 16.7 | 14.6 | 7.9 |
| Jan 11-20 | 18.4 | 15.9 | 13.9 | 7.2 |
| Jan 21-31 | 18.3 | 15.8 | 13.8 | 9.8 |
| Feb 01-10 | 18.0 | 15.6 | 13.6 | 14.3 |
| Feb 11-20 | 19.3 | 16.8 | 14.9 | 22.2 |
| Feb 21-29 | 18.6 | 16.4 | 14.5 | 15.8 |
| Mar 01-10 | 20.3 | 17.7 | 15.7 | 21.4 |
| Mar 11-20 | 21.5 | 19.0 | 17.1 | 22.6 |
| Mar 21-31 | 22.5 | 19.9 | 17.9 | 27.3 |
| Apr 01-10 | 23.2 | 20.8 | 19.0 | 73.5 |
| Apr 11-20 | 25.2 | 22.5 | 20.6 | 47.2 |
| Apr 21-30 | 26.9 | 24.1 | 22.1 | 67.8 |
| May 01-10 | 27.5 | 24.8 | 22.9 | 112.9 |
| May 11-20 | 28.6 | 25.9 | 24.1 | 101.6 |
| May 21-31 | 29.0 | 26.5 | 24.7 | 115.1 |
| Jun 01-10 | 29.7 | 27.2 | 25.4 | 138.4 |
| Jun 11-20 | 30.4 | 28.0 | 26.2 | 144.1 |
| Jun 21-30 | 31.1 | 28.6 | 26.7 | 105.6 |
| Jul 01-10 | 31.4 | 28.8 | 26.8 | 91.3 |
| Jul 11-20 | 31.4 | 28.7 | 26.6 | 133.3 |
| Jul 21-31 | 31.2 | 28.6 | 26.6 | 149.9 |
| Aug 01-10 | 31.3 | 28.6 | 26.5 | 132.4 |
| Aug 11-20 | 31.1 | 28.4 | 26.3 | 151.3 |
| Aug 21-31 | 31.0 | 28.3 | 26.3 | 160.9 |
| Sep 01-10 | 30.9 | 28.2 | 26.2 | 104.4 |
| Sep 11-20 | 30.4 | 27.8 | 25.7 | 88.1 |
| Sep 21-30 | 29.2 | 26.7 | 24.9 | 95.0 |
| Oct 01-10 | 29.0 | 26.5 | 24.5 | 48.7 |
| Oct 11-20 | 27.9 | 25.4 | 23.6 | 72.8 |
| Oct 21-31 | 26.5 | 24.0 | 22.1 | 30.4 |
| Nov 01-10 | 25.5 | 23.0 | 21.1 | 14.0 |
| Nov 11-20 | 23.9 | 21.3 | 19.2 | 12.1 |
| Nov 21-30 | 22.6 | 19.9 | 17.7 | 9.0 |
| Dec 01-10 | 21.5 | 18.9 | 16.8 | 11.6 |
| Dec 11-20 | 20.2 | 17.6 | 15.6 | 9.9 |
| Dec 21-31 | 19.4 | 16.8 | 14.7 | 13.0 |
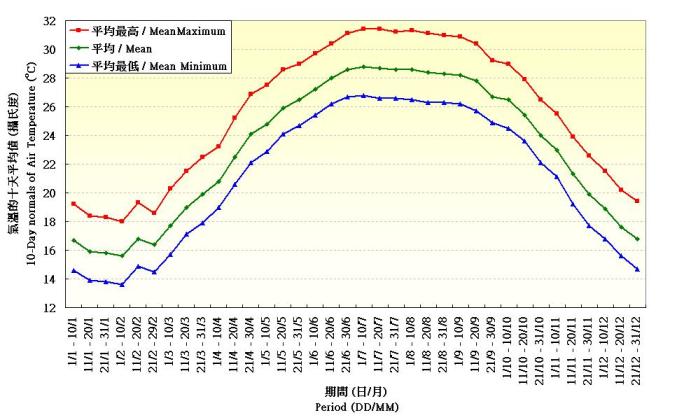
Figure 1. 10-Day normals of Air Temperature recorded at the Hong Kong Observatory(1971-2000)
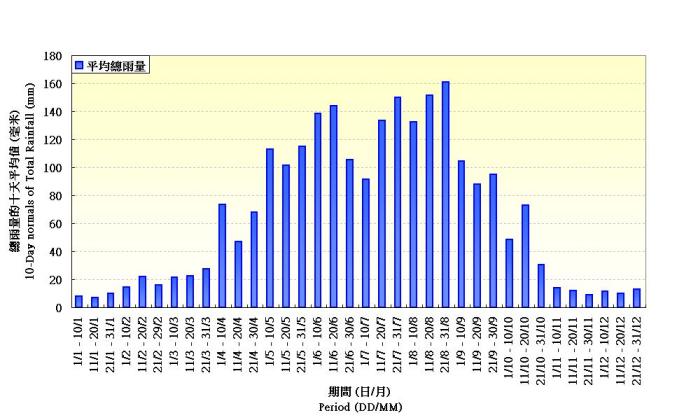
Figure 2. 10-Day normals of Rainfall recorded at the Hong Kong Observatory (1971-2000)