10-Day normals of Air Temperature and Rainfall recorded at the Hong Kong Observatory, 1981-2010
| Date | Air Temperature Figure |
Mean Total Rainfall (mm) Figure |
||
|---|---|---|---|---|
| Mean Maximum (deg.C) |
Mean (deg.C) |
Mean Minimum (deg.C) |
||
| Jan 01-10 | 19.1 | 16.9 | 15.1 | 6.7 |
| Jan 11-20 | 18.6 | 16.4 | 14.5 | 7.6 |
| Jan 21-31 | 18.0 | 15.7 | 13.9 | 10.7 |
| Feb 01-10 | 18.4 | 16.2 | 14.4 | 17.8 |
| Feb 11-20 | 19.3 | 17.1 | 15.4 | 21.7 |
| Feb 21-29 | 19.0 | 16.9 | 15.2 | 15.7 |
| Mar 01-10 | 20.0 | 17.6 | 15.8 | 19.5 |
| Mar 11-20 | 21.8 | 19.4 | 17.5 | 20.5 |
| Mar 21-31 | 22.4 | 20.1 | 18.3 | 42.2 |
| Apr 01-10 | 23.3 | 21.2 | 19.5 | 64.2 |
| Apr 11-20 | 25.0 | 22.5 | 20.7 | 51.7 |
| Apr 21-30 | 26.6 | 24.0 | 22.2 | 58.7 |
| May 01-10 | 27.7 | 25.1 | 23.3 | 102.9 |
| May 11-20 | 28.7 | 26.1 | 24.2 | 80.6 |
| May 21-31 | 28.8 | 26.5 | 24.8 | 121.4 |
| Jun 01-10 | 29.5 | 27.2 | 25.5 | 154.8 |
| Jun 11-20 | 30.2 | 28.0 | 26.3 | 149.1 |
| Jun 21-30 | 30.9 | 28.6 | 26.7 | 152.3 |
| Jul 01-10 | 31.3 | 28.8 | 26.8 | 102.4 |
| Jul 11-20 | 31.5 | 28.9 | 26.8 | 134.7 |
| Jul 21-31 | 31.3 | 28.7 | 26.7 | 139.5 |
| Aug 01-10 | 31.3 | 28.8 | 26.8 | 130.2 |
| Aug 11-20 | 31.0 | 28.4 | 26.5 | 158.0 |
| Aug 21-31 | 31.0 | 28.5 | 26.6 | 144.0 |
| Sep 01-10 | 30.7 | 28.3 | 26.3 | 117.1 |
| Sep 11-20 | 30.3 | 27.9 | 25.9 | 127.3 |
| Sep 21-30 | 29.4 | 27.0 | 25.2 | 83.5 |
| Oct 01-10 | 28.8 | 26.5 | 24.7 | 42.5 |
| Oct 11-20 | 28.0 | 25.8 | 24.1 | 39.9 |
| Oct 21-31 | 26.6 | 24.3 | 22.5 | 18.4 |
| Nov 01-10 | 25.4 | 23.1 | 21.3 | 14.6 |
| Nov 11-20 | 24.0 | 21.7 | 19.7 | 12.6 |
| Nov 21-30 | 22.8 | 20.5 | 18.5 | 10.7 |
| Dec 01-10 | 21.3 | 19.0 | 17.1 | 6.1 |
| Dec 11-20 | 20.1 | 17.9 | 15.9 | 8.8 |
| Dec 21-31 | 19.3 | 17.0 | 15.0 | 11.8 |
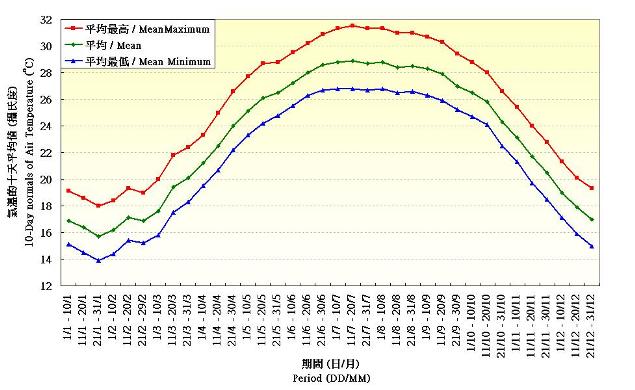
Figure 1. 10-Day normals of Air Temperature recorded at the Hong Kong Observatory(1981-2010)
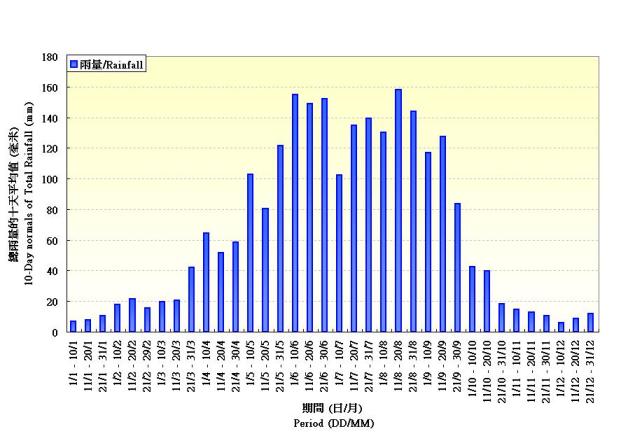
Figure 2. 10-Day normals of Rainfall recorded at the Hong Kong Observatory (1981-2010)