10-Day normals of Air Temperature and Rainfall recorded at the Hong Kong Observatory, 1991-2020
| Date | Air Temperature Figure |
Mean Total Rainfall (mm) Figure |
||
|---|---|---|---|---|
| Mean Maximum (deg.C) |
Mean (deg.C) |
Mean Minimum (deg.C) |
||
| Jan 01-10 | 19.3 | 17.2 | 15.4 | 7.4 |
| Jan 11-20 | 18.7 | 16.5 | 14.6 | 12.6 |
| Jan 21-31 | 18.1 | 15.9 | 14 | 13.3 |
| Feb 01-10 | 18.8 | 16.5 | 14.7 | 12.7 |
| Feb 11-20 | 19.6 | 17.2 | 15.3 | 17.6 |
| Feb 21-29 | 20 | 17.7 | 15.9 | 8.5 |
| Mar 01-10 | 21 | 18.4 | 16.6 | 21.2 |
| Mar 11-20 | 21.8 | 19.4 | 17.6 | 9.4 |
| Mar 21-31 | 22.9 | 20.4 | 18.6 | 44.6 |
| Apr 01-10 | 24 | 21.6 | 19.8 | 51.4 |
| Apr 11-20 | 25.7 | 23 | 21.1 | 52.2 |
| Apr 21-30 | 27 | 24.4 | 22.5 | 49.4 |
| May 01-10 | 27.9 | 25.4 | 23.5 | 102.1 |
| May 11-20 | 29.1 | 26.5 | 24.6 | 68.9 |
| May 21-31 | 29.3 | 27 | 25.2 | 119.6 |
| Jun 01-10 | 30.4 | 28 | 26.2 | 155.2 |
| Jun 11-20 | 30.5 | 28.2 | 26.4 | 180.2 |
| Jun 21-30 | 31.3 | 28.8 | 26.9 | 156.1 |
| Jul 01-10 | 31.6 | 29 | 27 | 98.1 |
| Jul 11-20 | 31.5 | 28.9 | 26.9 | 142.9 |
| Jul 21-31 | 31.6 | 28.9 | 26.9 | 144.7 |
| Aug 01-10 | 31.6 | 28.9 | 26.9 | 138.2 |
| Aug 11-20 | 31 | 28.5 | 26.6 | 163.9 |
| Aug 21-31 | 31.4 | 28.7 | 26.7 | 151.1 |
| Sep 01-10 | 30.8 | 28.3 | 26.4 | 110.8 |
| Sep 11-20 | 30.7 | 28.1 | 26.2 | 124.6 |
| Sep 21-30 | 29.9 | 27.4 | 25.6 | 86 |
| Oct 01-10 | 29.2 | 26.8 | 24.9 | 51 |
| Oct 11-20 | 28.1 | 25.7 | 24 | 55.4 |
| Oct 21-31 | 27.1 | 24.6 | 22.8 | 13.9 |
| Nov 01-10 | 25.9 | 23.5 | 21.7 | 14.4 |
| Nov 11-20 | 24.4 | 22.1 | 20.3 | 10.7 |
| Nov 21-30 | 23.2 | 20.9 | 19 | 14.2 |
| Dec 01-10 | 21.5 | 19.3 | 17.4 | 8.1 |
| Dec 11-20 | 20.1 | 18 | 16.1 | 11.9 |
| Dec 21-31 | 19.6 | 17.3 | 15.2 | 8.9 |
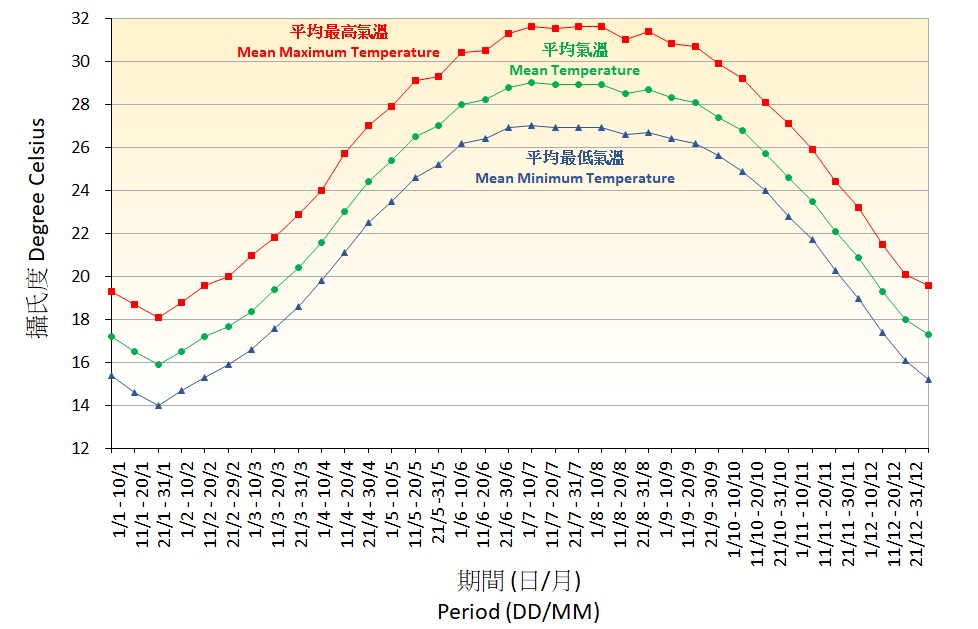
Figure 1. 10-Day normals of Air Temperature recorded at the Hong Kong Observatory(1991-2020)
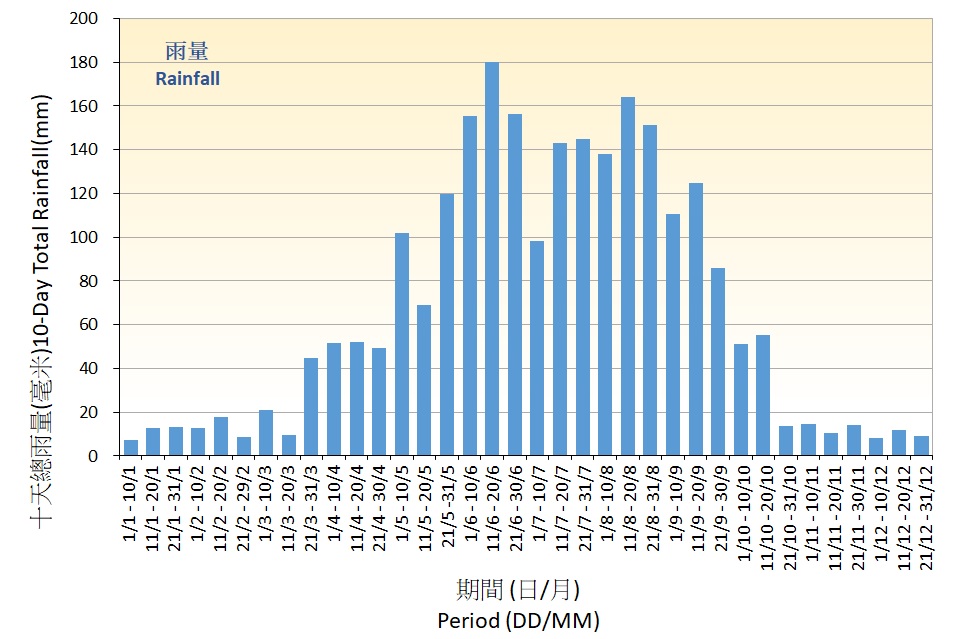
Figure 2. 10-Day normals of Rainfall recorded at the Hong Kong Observatory (1991-2020)