Information of the 12 May Sichuan Earthquake
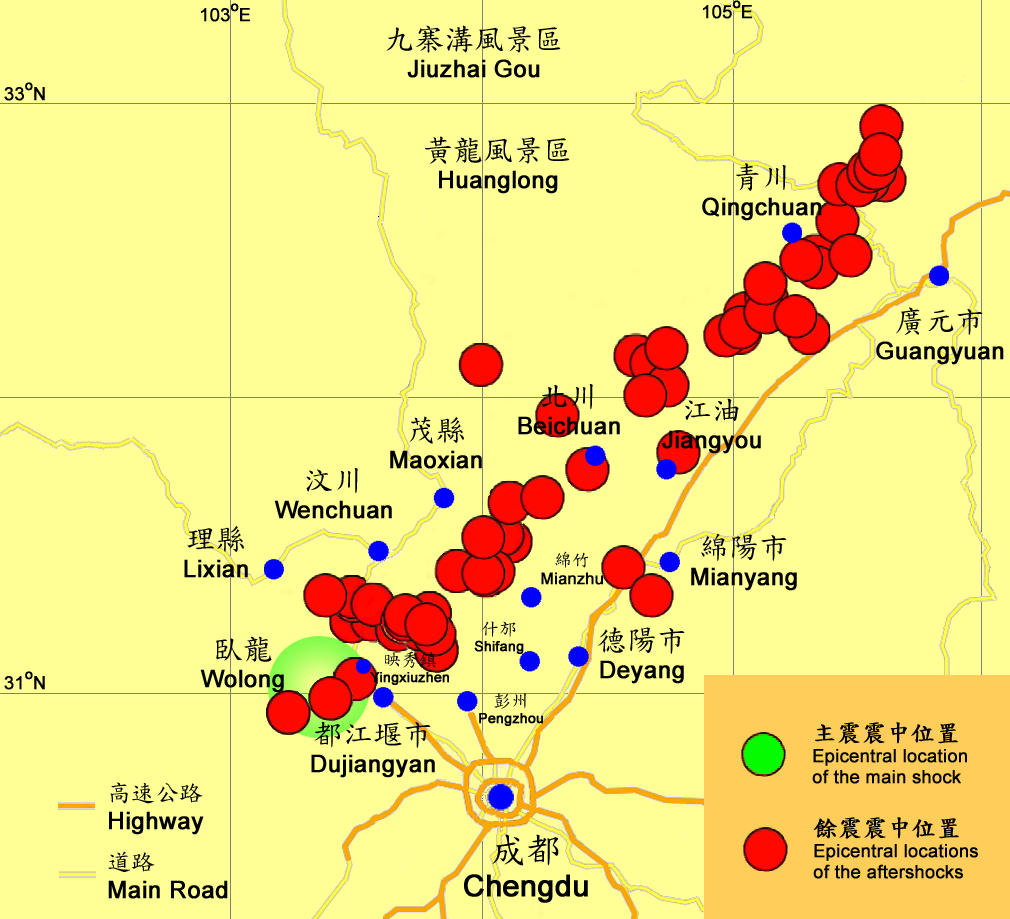
Illustrative diagram of the epicentral locations of the 12 May earthquake and aftershocks (Up to 2010.5.18)
(MAGNITUDE 5.0 OR ABOVE)
Illustrative diagram of crustal slips of the 12 May earthquake
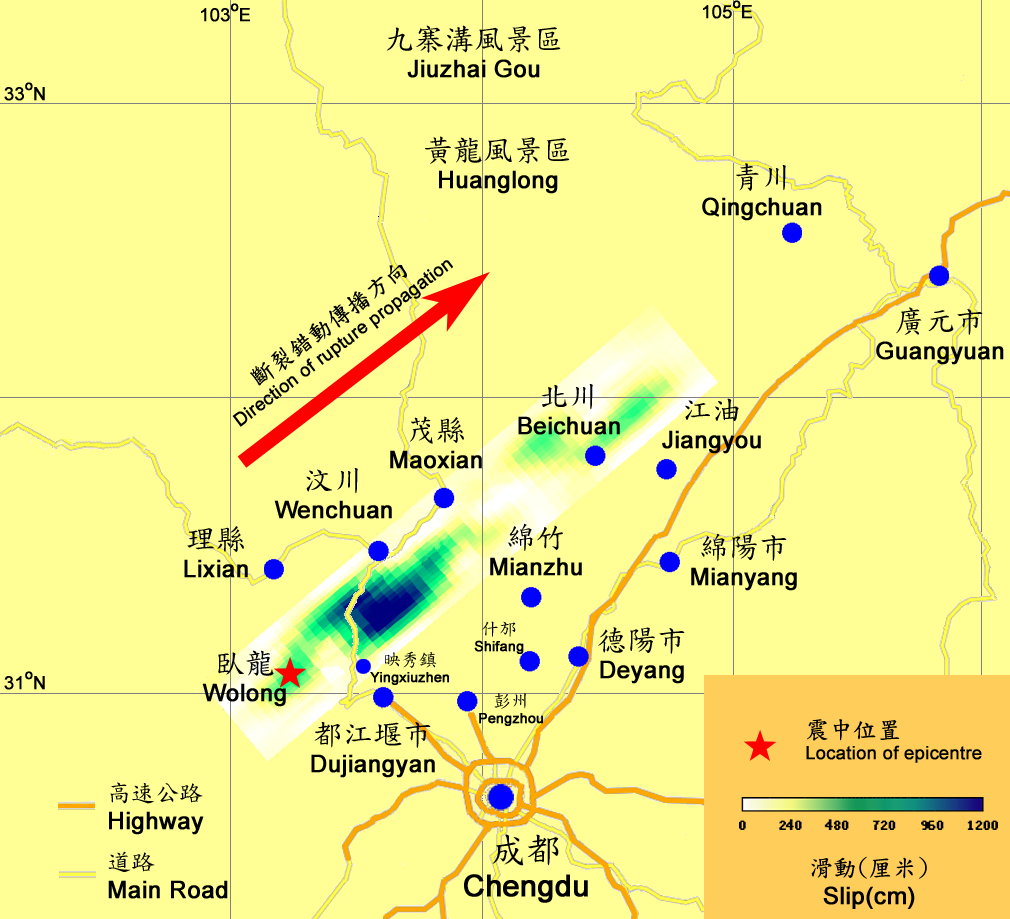
Data Source: China Earthquake Administration