Xizang M7.1 Earthquake on 7 January 2025
7 January 2025
CHAN Yuk-po Bowie, WONG Cheuk-yiu Lillian
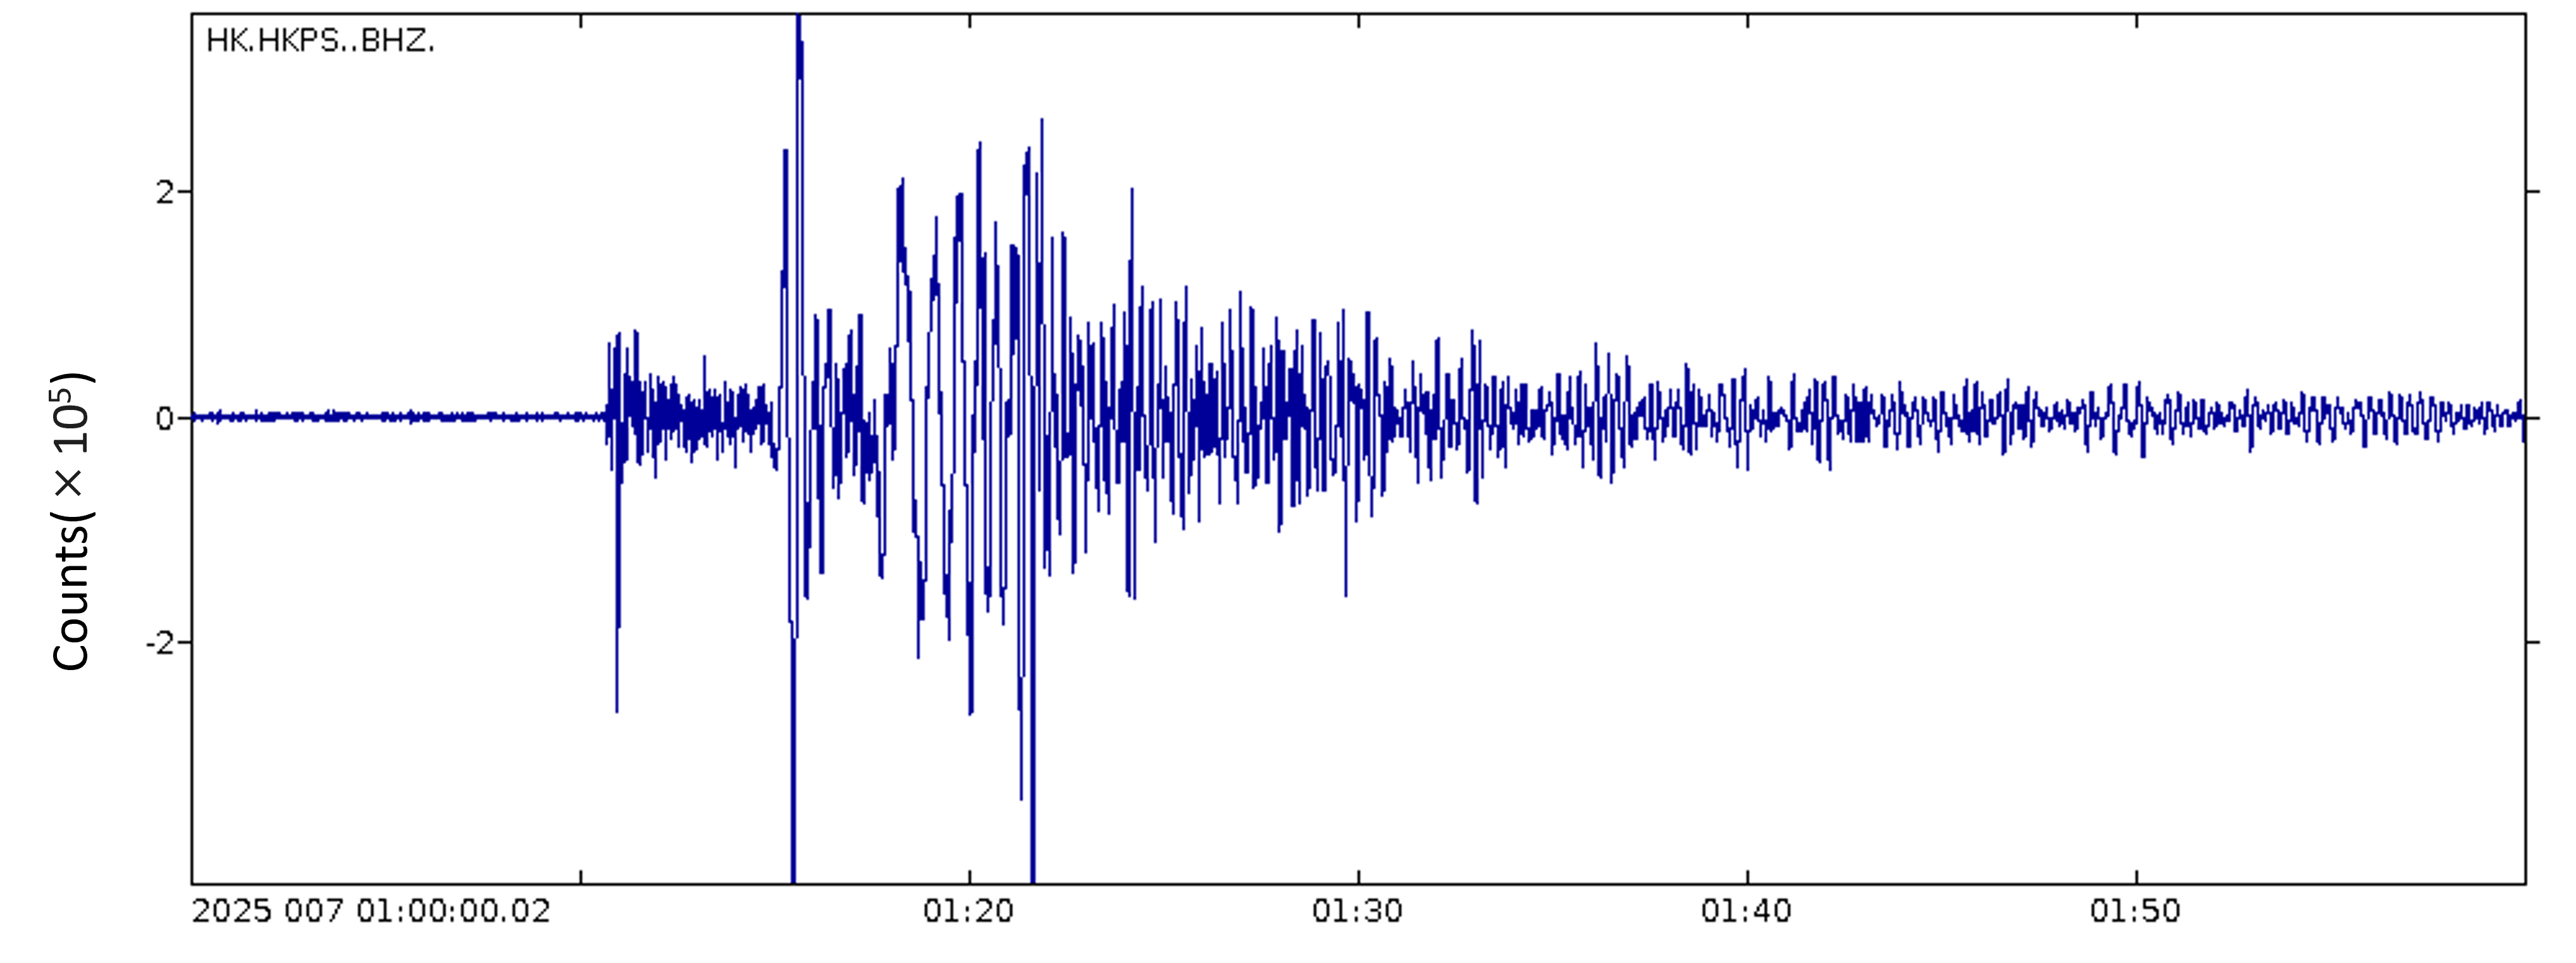
A major earthquake with magnitude 7.1 occurred in Xizang at 9:05 a.m. on 7 January 2025 according to the analysis of the Hong Kong Observatory (HKO). The epicentre was about 160 kilometres west-southwest of Rikaze, and about 2,770 km west-northwest of Hong Kong. The focal depth was around 10 km. HKO issued a strong earthquake report to the public approximately 12 minutes after the occurrence of the earthquake through multiple channels, including HKO’s website, “MyObservatory” mobile application, social media and the Government News and Media Information System. The seismic stations of HKO also recorded this earthquake (Figure 1). Since the earthquake was distant from Hong Kong, it was not locally felt.
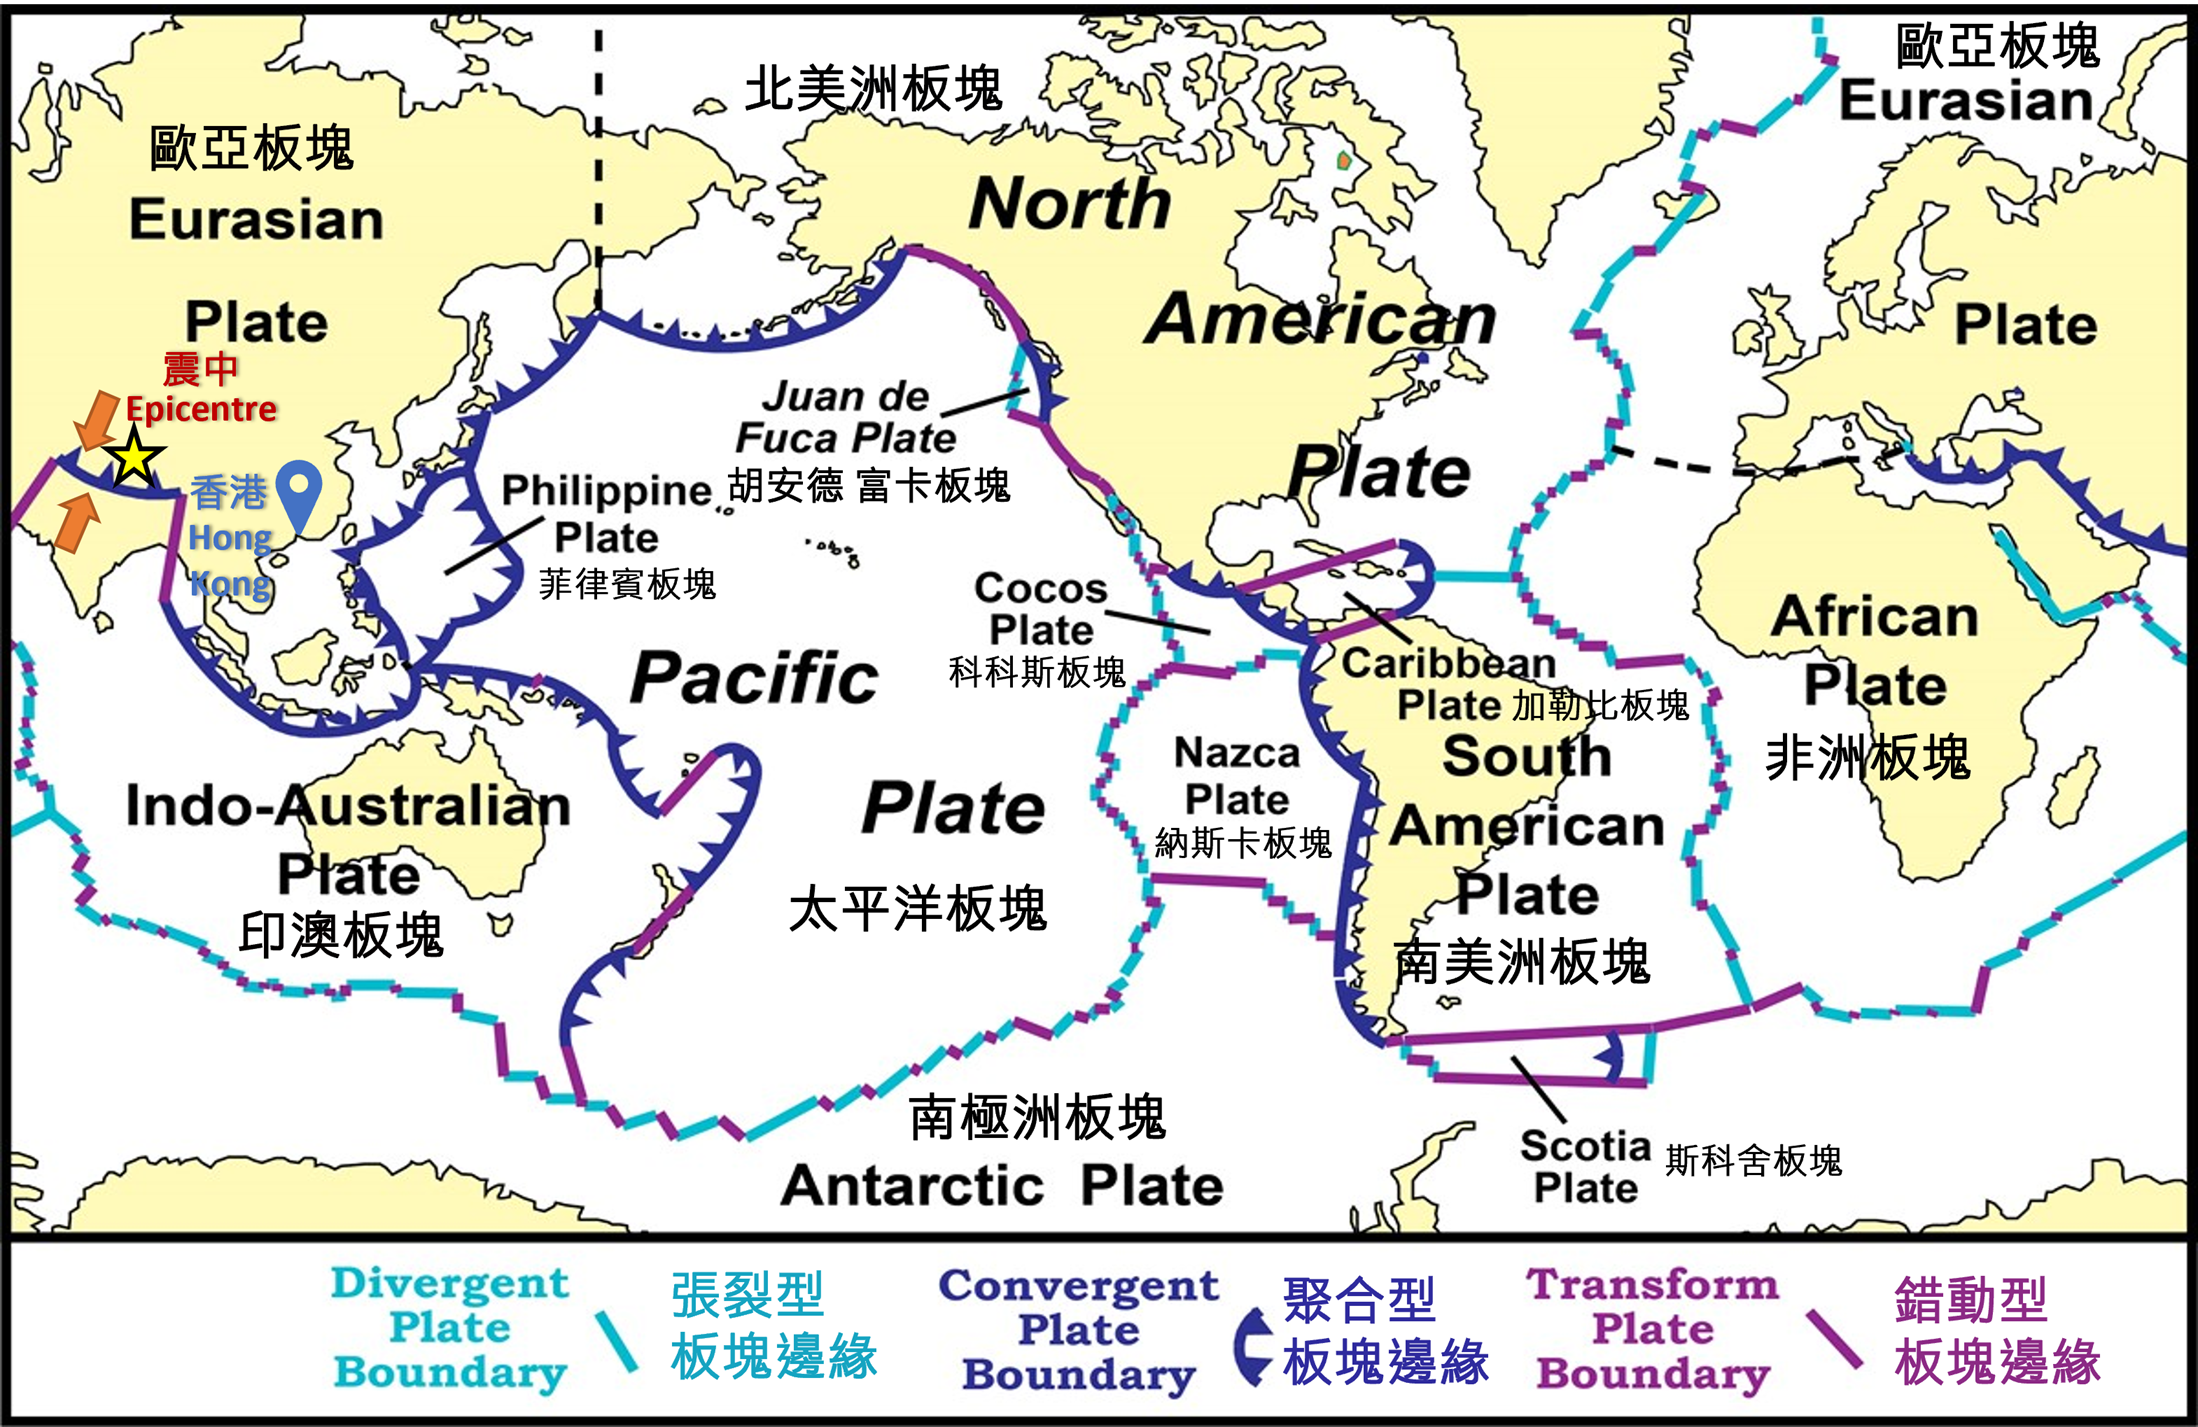
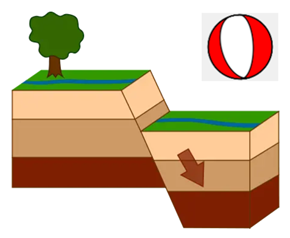
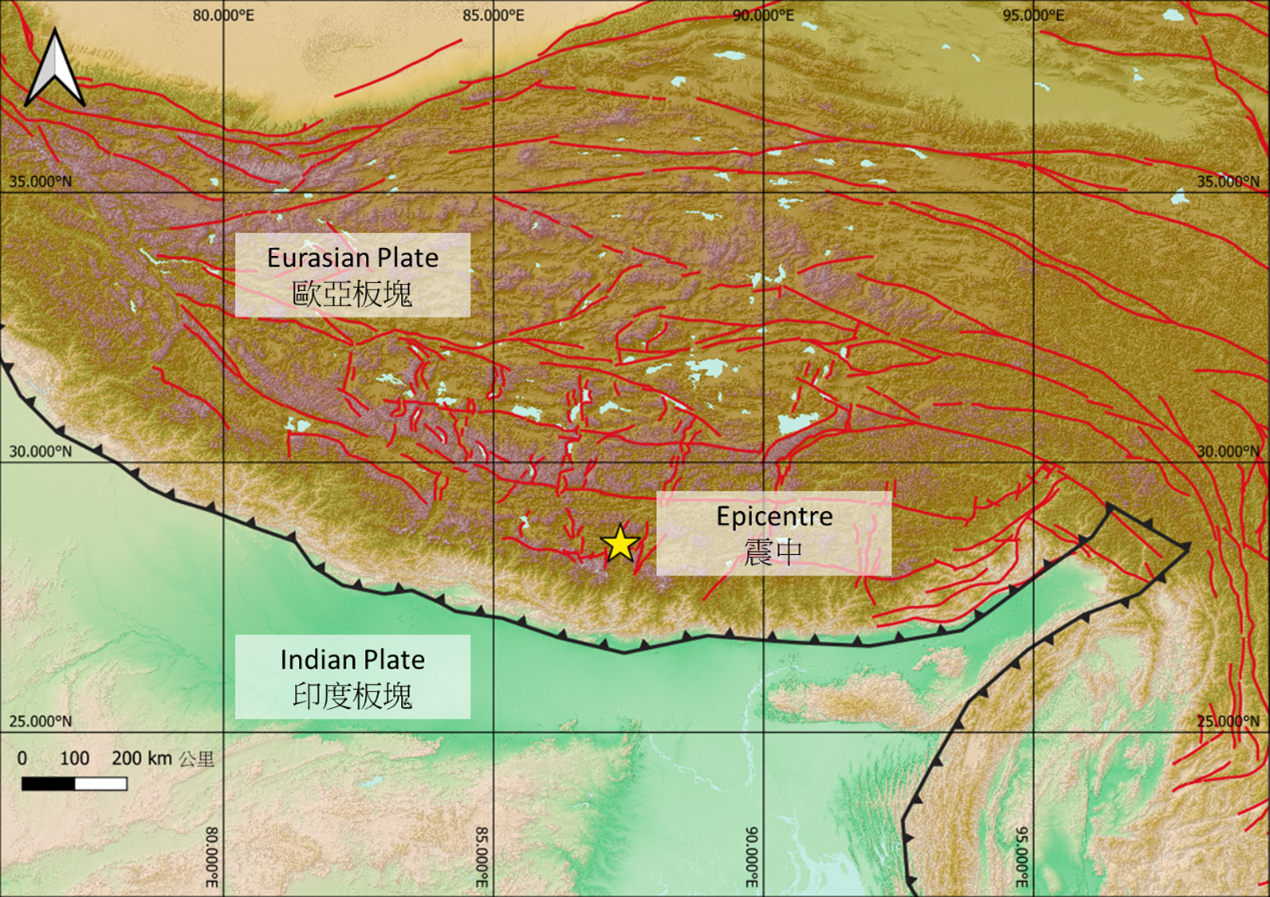
According to reports, this shallow earthquake resulted in over 100 deaths and more than 100 injuries, as well as collapse of nearly three thousand houses in that area. The earthquake took place on a north-south striking normal fault near the boundary between the Eurasian Plate and the Indian Plate (part of the Indo-Australian Plate) (Figures 2 and 3). At least dozens of aftershocks followed the mainshock, with most of them below magnitude 3.
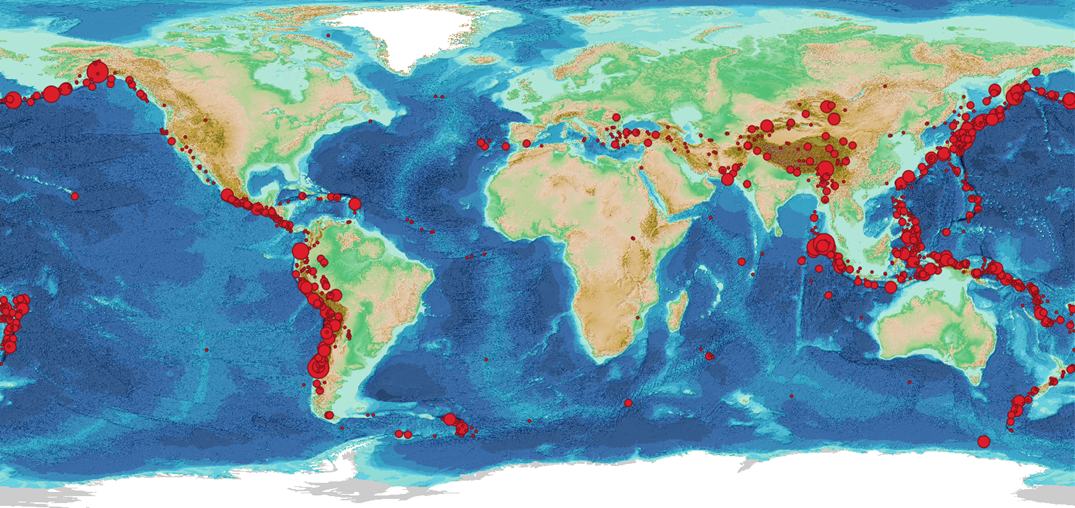
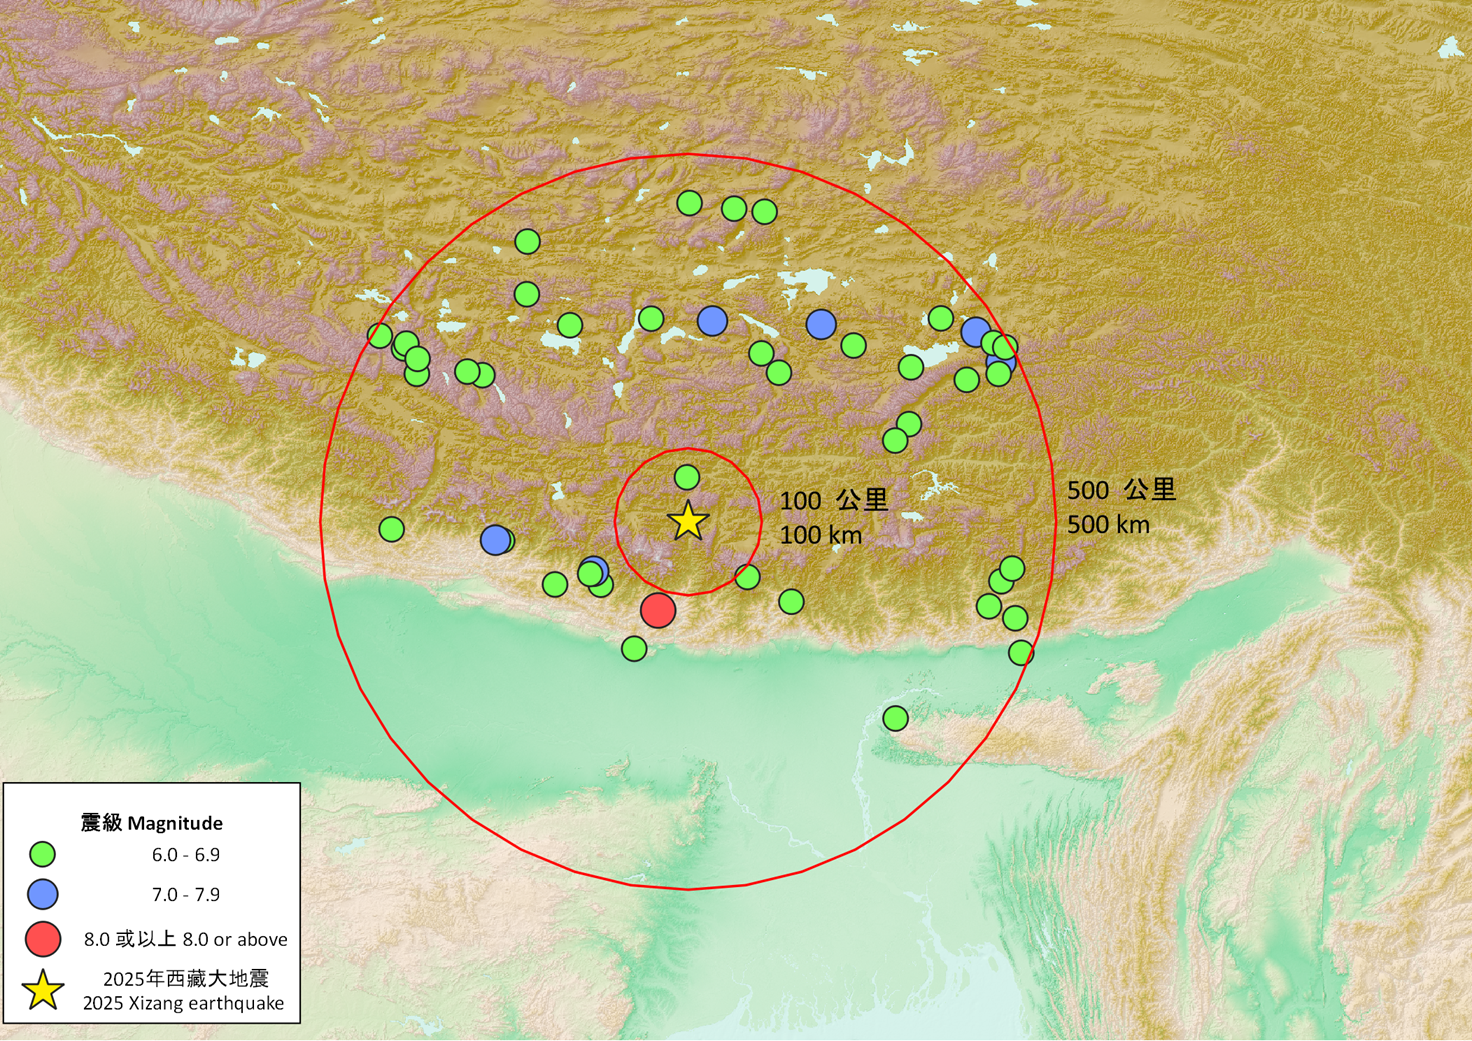
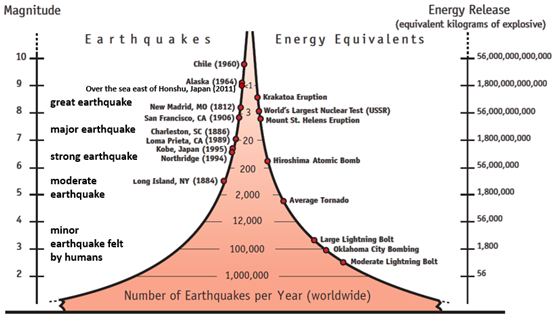
Major earthquakes generally occur more frequently at plate boundaries (Figure 4). The continental collisions between the Eurasian Plate and the Indian Plate have created complex fault systems at the periphery and interior of the Tibetan Plateau, resulting in active seismic activities (Figure 5). The largest earthquake that occurred within 500 km of this epicentre since 1908 was the M8.0 Nepal earthquake on 15 January 1934 (Figure 6). However, this M7.1 event has been the largest one within 100 km of the epicentre since instrumental records began. The frequency of earthquakes decreases with earthquake magnitude. Nearly twenty earthquakes of M7.0 or above occur globally each year on average (Figure 7). The previous one was the M7.4 earthquake near Vanuatu Islands on 17 December 2024.
References:
[1] National Park Service: Evidence of Plate Motions
[2] USGS Geological Survey: What is a fault and what are the different types?
[3] United States Geological Survey (USGS): Earthquake Catalog
[4] Seismic Active Fault Survey Data Center of China Earthquake Disaster Prevention Center
[5] EarthScope: How Often Do Earthquake Occur?
[6] HKO: How to Interpret Seismic Parameters?