|
|
| |
Figure 2. ESSA-8 APT picture of Typhoon "Rose" taken at 10.09 a.m. August 12, 1971. |
|
| |
|
|
| |
Figure 3. ESSA-8 APT picture of Typhoon "Rose" taken at 11.00 a.m. on August 13, 1971. |
|
| |
|
|
| |
Figure 4. ESSA-8 APT picture of Typhoon "Rose" taken at 11.52 a.m. on August 14, 1971. |
|
| |
|
|
| |
Figure 5. ESSA-8 APT picture of Typhoon "Rose" taken at 10.48 a.m. on August 15, 1971. |
|
| |
|
|
| |
Figure 6. Radar picture of Typhoon "Rose" taken at the Royal Observatory at 10.27 p.m. on August 15, 1971. |
|
| |
|
|
| |
Figure 7. Radar picture of Typhoon "Rose" taken at the Royal Observatory at 12.05 a.m. on August 16, 1971. |
|
| |
|
|
| |
Figure 8(a). ESSA-8 APT picture of Typhoon "Rose" taken at 11.33 a.m. on August 16, 1971. |
|
| |
|
|
| |
Figure 8(b). ESSA-8 APT picture of Typhoon "Rose" taken at 11.39 a.m. on August 16, 1971. |
|
| |
|
|
| |
Figure 8(c). A digitized mosaic of satellite picture of Typhoon "Rose" taken on August 16, 1971. (By Courtesy of ESSA) |
|
| |
|
|
| |
Figure 9. Radar picture of Typhoon "Rose" taken at 1.00 p.m. on August 16, 1971. |
|
| |
 |
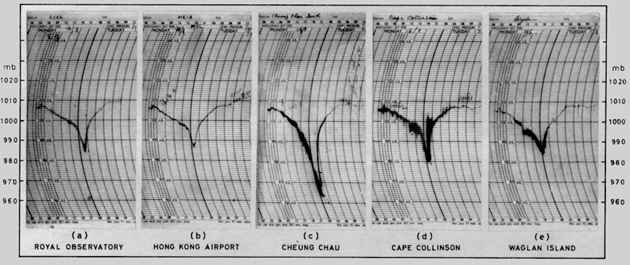
| Figure 10. Record of barometric pressure at various meteorological stations in Hong Kong during the passage of Typhoon "Rose" on August 16 - 17, 1971. |
| |
 |
| |
Figure 11. Record of wind speed and direction at the Royal Observatory during the passage of Typhoon "Rose" on August 16 - 17, 1971. |
|
| |
|
|
| |
Figure 12. Quick-run record of wind speed and direction at the Hong Kong International Airport during the passage of Typhoon "Rose" on August 17, 1971. |
|
| |
|
|
| |
Figure 13. Record of wind speed and direction at Cape Collinson during the passage of Typhoon "Rose" on August 16 - 17, 1971. |
|
| |
|
|
| . |
Figure 14. Quick-run record of wind speed and direction at Cheung Chau during the passage of Typhoon "Rose" on August 17, 1971 |
|
| |
|
|
| |
Figure 15. Quick-run record of wind speed and direction at Waglan Island during the passage of Typhoon "Rose" on August 17, 1971. |
|
| |
|
|
| |
Figure 16. Trajectory of the centre of the eye of Typhoon "Rose" over the western part of Hong Kong on August 17, 1971. |
|
| |
|
|
| |
Figure 17. Hourly amounts of rainfall and barometric pressure profile as recorded at the Royal Observatory during the passage of Typhoon "Rose" on August 16 - 17, 1971. |
|
|
|