Rainfall Measurements and Hydrometeorology in Hong Kong
Introduction :
The hydrological cycle involves the movement of water in three phases from the ocean, land or living matter into the atmosphere by evaporation and transpiration and back into the earth's surface through a chain of complex atmospheric processes.Hydrometeorology is concerned with the study of these atmospheric processes which affect the water resources of the earth and which are of interest to the meteorologist and the hydrological engineer. Measurements of rainfall and water loss as a result of evaporation are essential for various applications in connection with water resources planning, drainage design, water quality control, reservoir design and operation, irrigation as well as hydrological forecasting and flood control.
History of Hydrometeorological Observations
Rainfall
Available records at the Observatory indicate that rainfall observation in Hong Kong started as early as 1853. The observations were made by the Royal Engineers until 1862, after which these were carried out in the Government Civil Hospital and the Army Medical Department. Following its establishment in 1883, the Hong Kong Observatory took over the responsibilities for rainfall measurements. Hourly rainfall data are available from 1884 up to the present time. Because of the Second World War, publication of observations was suspended from 1940 to 1946.
The first rainfall outstation was set up in 1906 in the police compound at Tai Po. The fact that the annual rainfall totals at this station differed as much as 20% from those recorded at the Observatory suggested a considerable spatial variation in the rainfall over Hong Kong and, as a result, other outstations were set up at the Botanical Garden, Matilda Hospital and at various reservoirs in the 1910's. By 1938, the number of rainfall stations reached 21.
During the period of Japanese occupation, rainfall observations had been carried out by Observatory staff imprisoned in various camps. The original records written on cigarette packets and scrap pieces of paper, though fragmentary, are still available. After the War, rainfall measurements resumed at the Observatory and at various reservoirs operated by the Waterworks Office (now the Water Supplies Department). Industrialization and rapid increase in the population accentuated the need to explore more water resources and by 1958, the rain-gauge network was expanded to 80 stations. From 1959 to 1963, the Plover Cove Reservoir Scheme required enhanced rainfall information and 18 rain-gauges were installed around the catchment areas. Currently the Observatory operates about 70 rainfall stations in the territory. Except for the Observatory Headquarters and meteorological stations manned by Observatory staff, manual rainfall observations are carried out by voluntary observers, building contractors and engineering consultants. Rainfall stations are inspected regularly to ensure proper maintenance of instruments and standardization in reporting.
Evaporation
Measurement of evaporation from a water surface commenced at King's Park in 1957. Daily observations have been made since then. In 1966, the Observatory assisted the Waterworks Office in setting up an evaporation station at Ting Kok near the Plover Cove Reservoir. Observations continued until 1970.
Evapotranspiration
Evapotranspiration is the total evaporation from moist soil and from vegetated surfaces plus transpiration. Potential evapotranspiration is defined as the evapotranspiration that would occur if a plant is supplied with ample moisture at all times. Daily measurements have been made at King's Park since 1951.
Methods of Measurement
Rainfall
Several types of rain-gauges are in use. The most common is the ordinary rain-gauge which is read manually using a measuring cylinder. A monthly gauge is similar to an ordinary gauge except that it has a larger collecting chamber.
The second type of rain-gauge is the autographic gauge which can be either of the tilting-siphon type or the tipping-bucket type. The recording chart on an autographic rain-gauge is mounted on a drum which is driven by clockwork and typically rotates round a vertical axis once per day. For a tilting-siphon rain-gauge, the rainwater in a collector displaces a float so that a marking pen attached to the float makes a continuous trace on the paper. The two buckets in a tipping-bucket rain-gauge rest on a pivot so that when one bucket has received 0.5 mm of rain it tips by gravity, empties the rainwater and allows the other bucket to start collection. During the tip, an electrical switch is closed and triggers a nearby autographic recorder.
Significant progress has been made since the late 1970's with the use of microprocessor technology to telemeter the electrical signals from tipping-bucket gauges at outstations to the Observatory Headquarters. This automation allows rainfall observations to be reported almost instantaneously, greatly facilitating the operation of the rainstorm and flood warnings as well as increasing the amount of data available for hydrometeorological analysis. Over 20 rain-gauges of the Observatory now are of this type.
In addition, the Geotechnical Engineering Office also operates a network of remote rain-gauges. Rainfall information in various parts of Hong Kong is shown on a video terminal and a graphic display unit at the Central Forecasting Office of the Observatory.
To measure the rate of rainfall, the Jardi rate-of-rainfall gauge operates on the principle that the position of the float in a collecting chamber is proportional to the rate of inflow of water. The motion of the float is transmitted to a pen by a system of levers.
Evaporation
At King's Park, two U.S. Weather Bureau Class `A' pans are used, one of them as a back-up. The pans are filled with water and a fixed point gauge is used in each pan to indicate the water level. At each daily observation, a carefully measured amount of water is added to or removed from (if the rainfall is heavy) the pan until the surface of the water just touches the fixed point. This amount of water represents the evaporation during the past 24 hours.
Evapotranspiration
The three lysimeters constructed at King's Park are built of brick and surfaced in cement plaster with short grass turfed on top. An outlet pipe leads from the bottom of each lysimeter to overflow tanks. Sufficient water is sprinkled on the grass every evening to ensure that a small overflow occurs in the outlet pipes before observation is taken the next morning. Assuming that the moisture contents in the lysimeter at the time of measurement remain the same as the previous day, the difference between the added water and the overflow represents the potential evapotranspiration. If there has been rain during the past 24 hours, the measured rainfall is also included in the calculation.
Analyses, Development and Investigations
Hydrometeorological analyses, development and investigations carried out by the Observatory include the following:
- (1) Forecasting of heavy rain -- Severe storm analysis, correlation of heavy rainfall with antecedent meteorological conditions.
- (2) Hydrometeorological studies -- Return period analysis of extreme rainfall, estimation of probable maximum precipitation, determination of design storms.
- (3) Instrumentation -- Construction and design of real-time rainfall recording systems including software development.
The results of the various investigations are published in departmental technical reports.
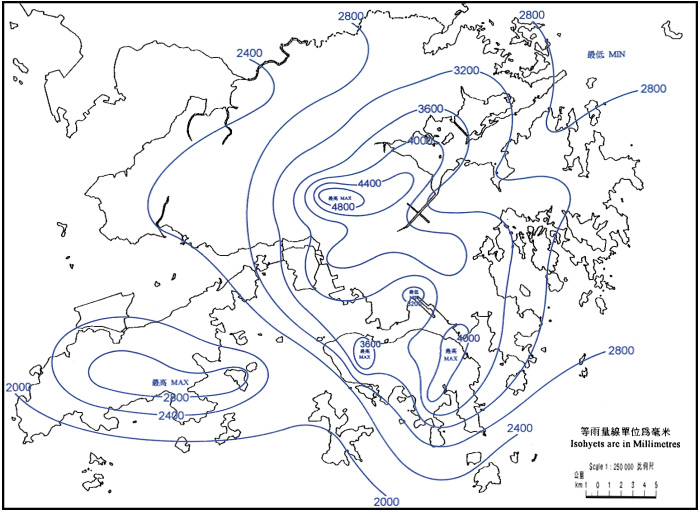
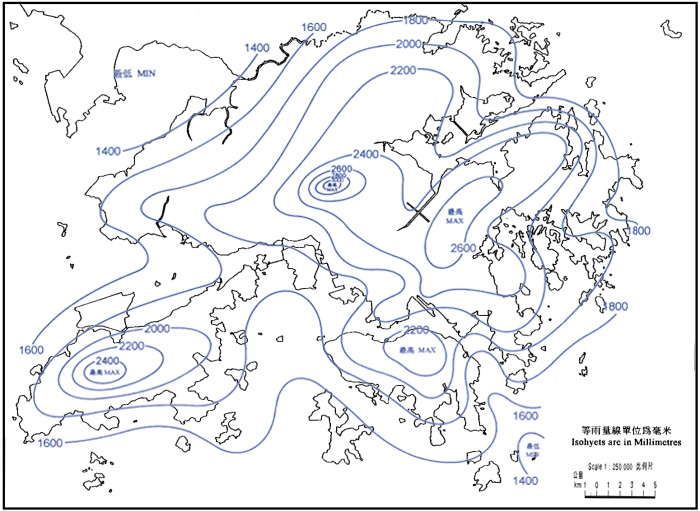
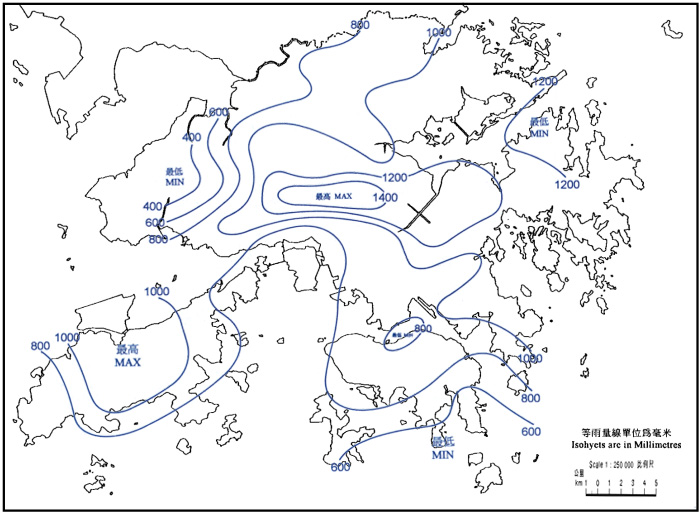
On a routine basis, the distribution of rainfall over Hong Kong is published in the Monthly Weather Summary. The monthly and annual rainfall recorded at all stations are published in Meteorological Results, Part I for 1884-1939, 1947-1986, Surface Observations in Hong Kong during 1987-1992 and in the Summary of Meteorological Observations in Hong Kong from 1993 onwards. The records are also published annually in the Water Supplies Department "Hong Kong Rainfall and Runoff". Measurements of evaporation and evapotranspiration can also be found in Meteorological Results Part I, Surface Observations in Hong Kong and Summary of Meteorological Observations in Hong Kong.


