The Year's Weather - 2015
Thursday, 7th January 2016
According to the World Meteorological Organization’s preliminary assessment, 2015 is likely to be the warmest year globally since records began in 1850. Over the Arctic, the minimum sea ice extent in September 2015 was the fourth lowest on record. Moreover, notable extreme weather events wreaked havoc in many parts of the world in 2015, including heatwaves in India, southern Pakistan, northern Africa, South Africa, the Middle East, southern Australia and many parts of Europe, snow storms in Boston and Worcester of the United States, drought in western North America, South Africa, Russia, southern Chile, Brazil and Indonesia, extreme rainfall and flooding in southern United States, Mexico, southeastern Europe, United Kingdom, Pakistan, China and Argentina, and torrential rain induced by tropical cyclones in southern United States, Myanmar, Japan and Yemen.
Over the central and eastern equatorial Pacific, the El Niño episode started in May 2014 and continued into 2015. The sea surface temperature warmed progressively and significantly during the course of the year, developing into a strong event by late summer and setting a record for the longest episode since 1950.
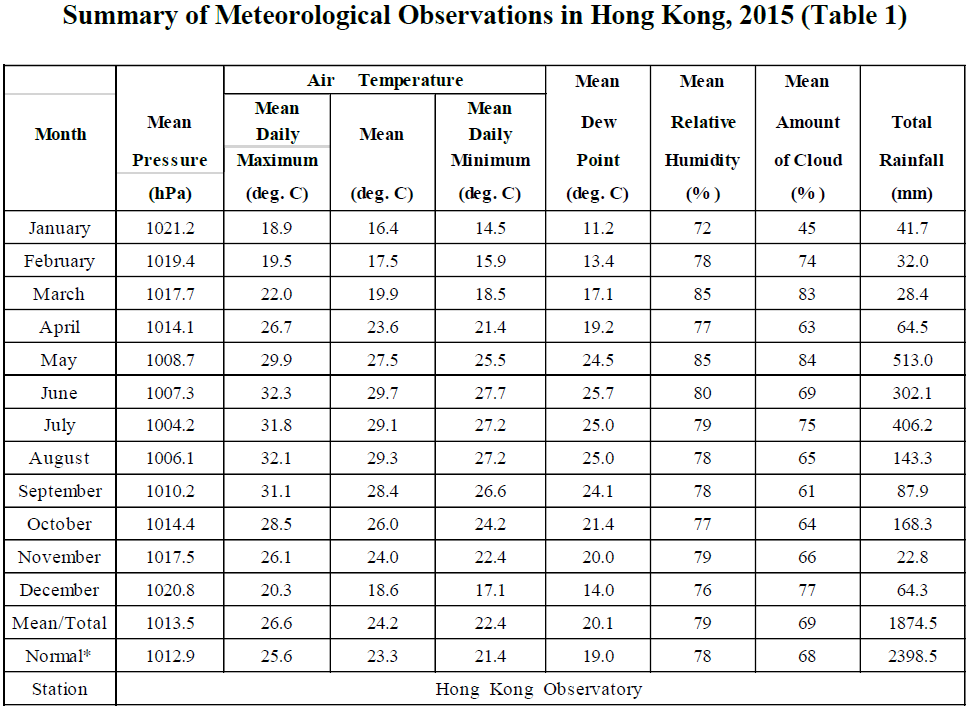
Against a background of global warming, 2015 also emerged as the warmest year in Hong Kong on record with an annual mean temperature of 24.2 degrees, 0.9 degrees above the 1981-2010 normal[1] (and 1.2 degrees above the 1961-1990 normal). The mean temperatures for June, November, summer (June to August) and autumn (September to November) all ranked the highest since records began in 1884.
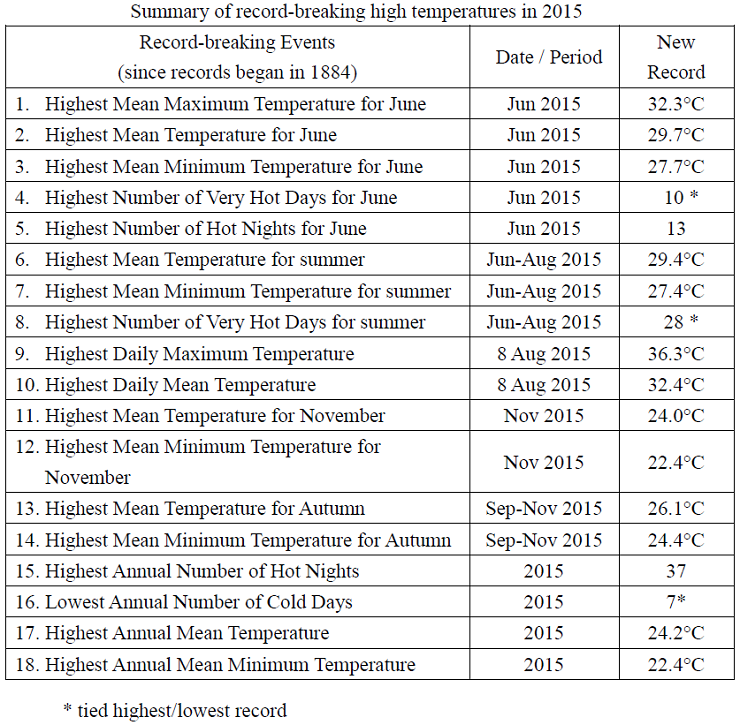
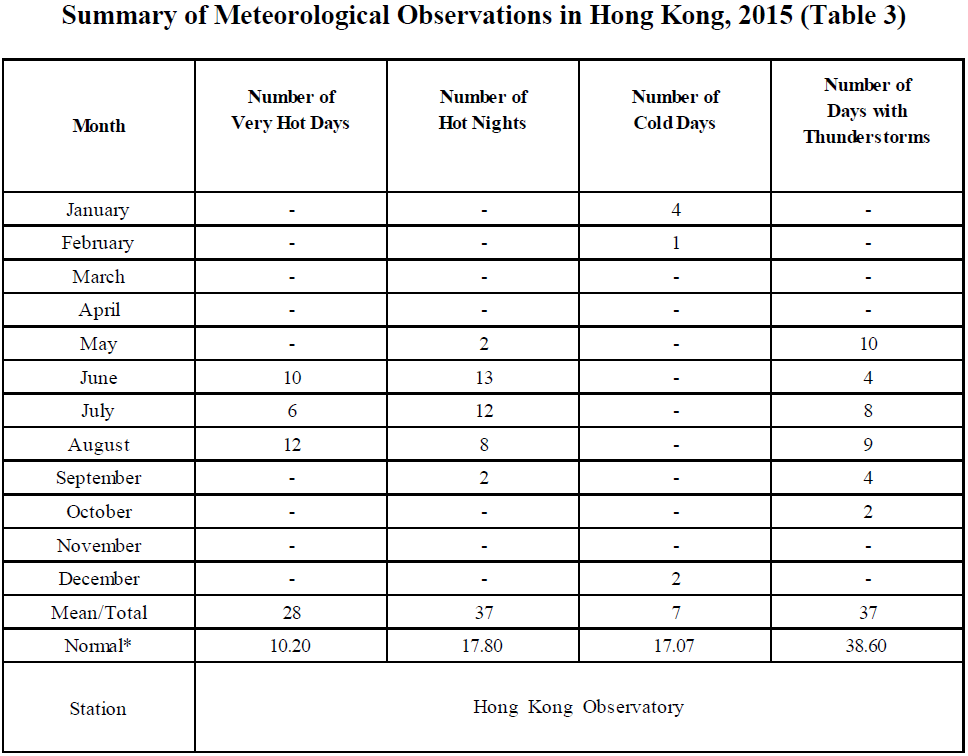
For extreme temperatures, there were 28 Very Hot Days[2] and 37 Hot Nights[3] in Hong Kong in 2015, ranking the fifth highest and the highest on record respectively. The number of Cold Days[4] in the year was only 7 days, 10 days below the 1981-2010 normal and one of the lowest on record. The maximum temperature recorded at the Hong Kong Observatory reached a record high of 36.3 degrees on 8 August, while the minimum temperature of 10.3 degrees recorded during the year on 14 January was the second highest on record.
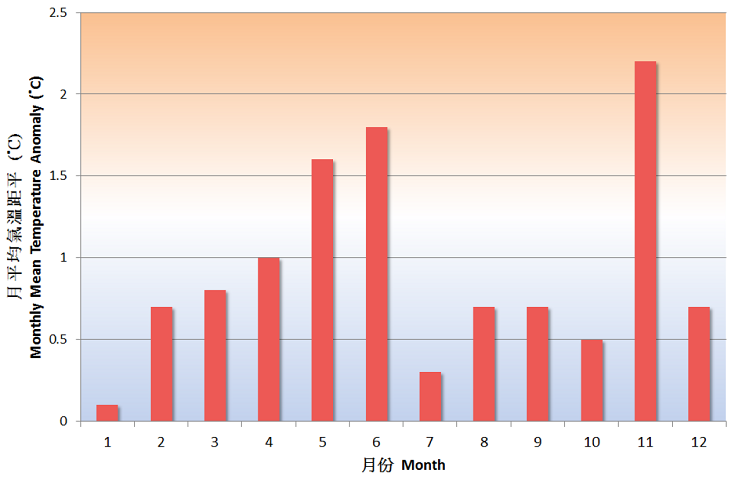
Fig. 1 Monthly mean temperature anomalies in Hong Kong in 2015
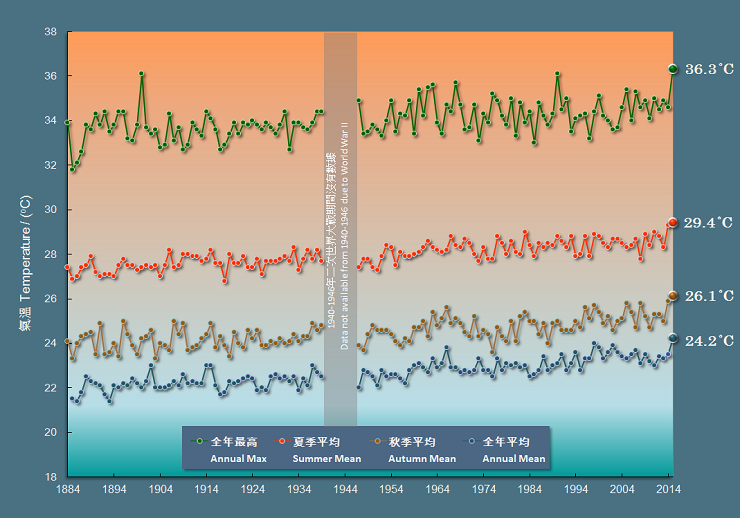
Fig. 2 Long-term trends of annual maximum, annual mean, summer mean and autumn mean temperatures recorded at the Hong Kong Observatory (1884-2015)
The year 2015 was drier than normal in Hong Kong. The annual total rainfall was 1874.5 millimetres, a deficit of 22 percent comparing to the 1981-2010 normal of 2398.5 millimetres (and about 15 percent below the 1961-1990 normal). The number of days with thunderstorms reported in Hong Kong was 37 days in 2015, close to the 1981-2010 normal. Affected by a trough of low pressure, torrential rain and intense thunderstorms in Hong Kong necessitated the issuance of the Black Rainstorm Warning on 26 May.
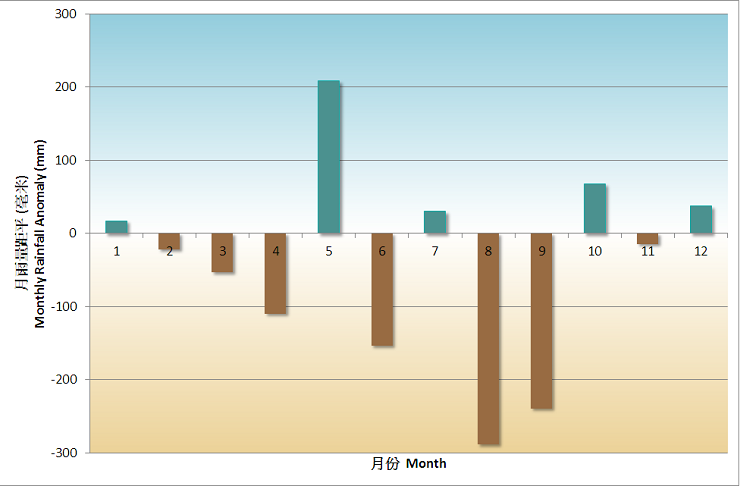
Fig. 3 Monthly rainfall anomalies in Hong Kong in 2015
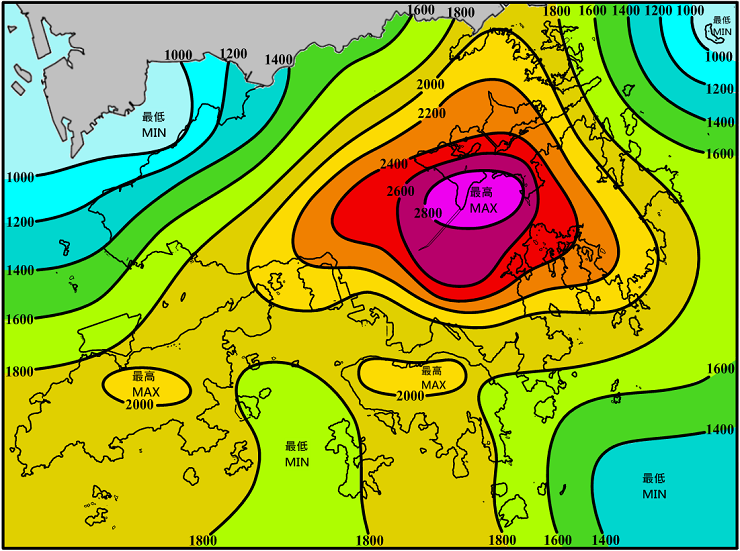
Fig. 4 Annual Rainfall Distribution in Hong Kong in 2015
A total of 27 tropical cyclones occurred over the western North Pacific and the South China Sea in 2015, less than the long-term (1961-2010) average of around 30. There were 20 tropical cyclones reaching typhoon intensity[5] or above during the year, more than the long-term average of about 15, and 13 of them reached super typhoon intensity (maximum 10-minute wind speed of 185 km/h or above near the centre), the highest since full records began in 1961. In Hong Kong, three tropical cyclones necessitated the issuance of local tropical cyclone warning signals, lower than the long-term average of about six in a year. The No. 8 Gale or Storm Signal was issued during the passage of Typhoon Linfa in July.
Detailed description of the weather for individual months is available on the Monthly Weather Summary webpage:
http://www.hko.gov.hk/wxinfo/pastwx/mws.htm
Some significant weather events in Hong Kong in 2015 are highlighted below:
Unsettled Weather with Black Rainstorm in May
Local weather was unsettled with several heavy rain episodes in May. A squall line associated with a cold front from southern China brought heavy showers and squally thunderstorms to Hong Kong on the evening of 11 May 2015, necessitating the issuance of the first Amber Rainstorm Warning in the year. Two ‘Red’ rainstorm episodes associated with a trough of low pressure lingering over the coastal areas of Guangdong occurred on 20 and 23 May, bringing more than 150 millimetres of rain to most parts of the territory. The intense thunderstorms on 23 May also caused serious disruption to the operation of Hong Kong International Airport where hundreds of flights were affected. Another rapidly developed rainstorm brought more than 70 millimetres of rain to the urban areas and over 100 millimetres to Sha Tin, Tsuen Wan, Sai Kung and Ma On Shan on 26 May, necessitating the issuance of the only Black Rainstorm Warning in the year.
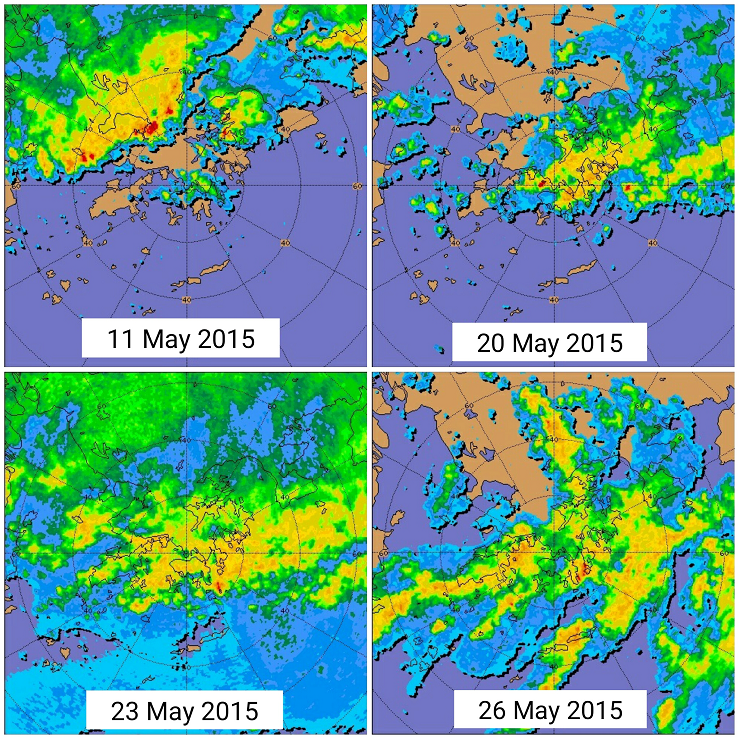
Fig. 5 Radar echoes for the four rainstorm episodes affecting Hong Kong in May 2015
No Tropical Cyclone Warning Signal in August and September
No tropical cyclone warning signal was issued in Hong Kong in August and September 2015, the first time since 1946. This was mainly attributed to the El Niño event which favoured more tropical cyclones forming further to the east and hence making them less likely to enter the South China Sea, and the weaker-than-normal southwesterly airstream during the two-month period and hence suppressing tropical cyclone development over the South China Sea.
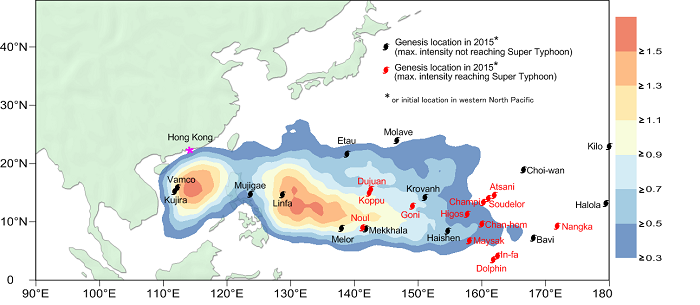
Fig. 6 Tropical cyclone genesis positions in 2015 were displaced further east comparing with the long-term (1961-2010) yearly average of tropical cyclone genesis distribution (colour-shaded area in the background)
High Temperatures in Summer and Autumn
Hong Kong experienced the hottest summer ever since records began in 1884. The mean temperature for June to August 2015 reached 29.4 degrees, breaking the previous record of 29.3 degrees set only last year. Moreover, June 2015 was the hottest June on record with a monthly mean temperature of 29.7 degrees. Under the subsidence effect associated with Typhoon Soudelor, the temperature at the Hong Kong Observatory soared to a record-breaking 36.3 degrees on 8 August 2015, beating the previous extreme of 36.1 degrees set in 1990.
The weather in Hong Kong was also unseasonably warm in autumn. Despite the prevailing northeast monsoon in November, a monthly mean temperature of 24.0 degrees made it the warmest November ever. The mean temperature for September to November recorded at the Hong Kong Observatory was 26.1 degrees, the highest on record for the period.
Notes :
[1] Climatological normals for the reference period of 1961-1990, 1971-2000 and 1981-2010 are available at : http://www.weather.gov.hk/cis/normal_e.htm.
Climatological normals of 1981-2010 are referenced in the text unless otherwise stated.
[2] 'Very Hot Day' refers to the condition with the daily maximum temperature equal to or higher than 33.0 degrees.
[3] 'Hot Night' refers to the condition with the daily minimum temperature equal to or higher than 28.0 degrees.
[4] 'Cold Day' refers to the condition with the daily minimum temperature equal to or lower than 12.0 degrees.
[5] Information on the classification of Tropical Cyclones is available at: http://www.hko.gov.hk/informtc/class.htm
* 1981-2010 Climatological Normal, unless otherwise specified
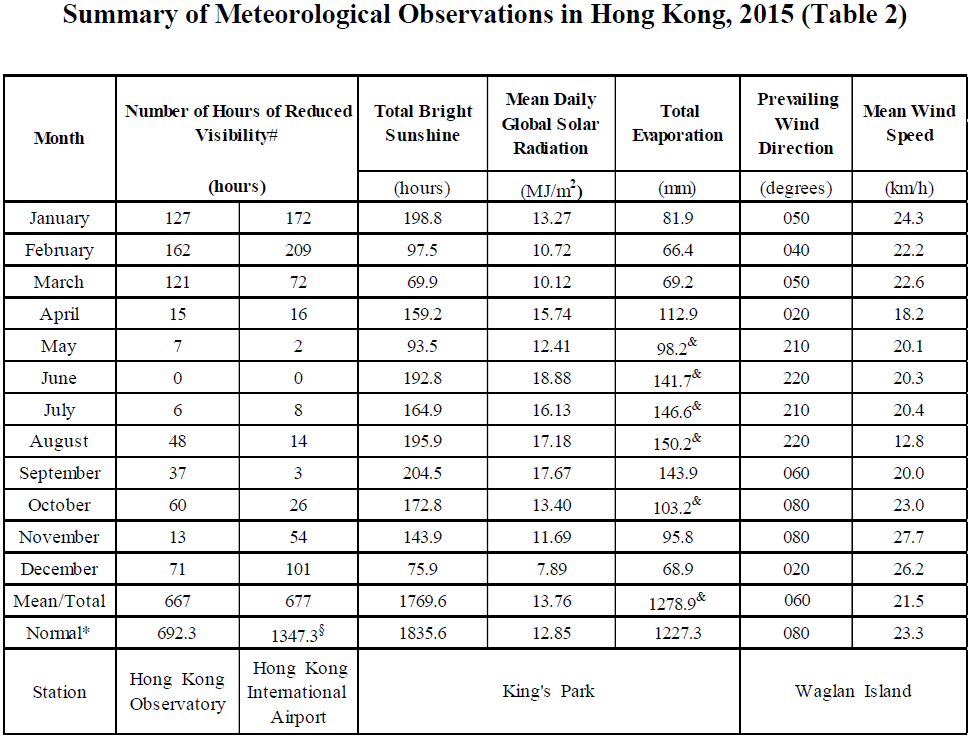
# Reduced visibility refers to visibility below 8 km when there is no fog, mist, or precipitation.
* 1981-2010 Climatological normal, unless otherwise specified
§ 1997-2014 Mean value
& data incomplete
^ In case the data are not available from Waglan Island, observations of Cheung Chau or other nearby weather stations will be incorporated in computing the Prevailing Wind Direction and Mean Wind Speed
* 1981-2010 Climatological Normal, unless otherwise specified