Global Climate Projections - Mean Sea Level
Global Climate Projections |
|||||||||||||||||||||||||||||||||||||||||||||||||||||||
|
|||||||||||||||||||||||||||||||||||||||||||||||||||||||
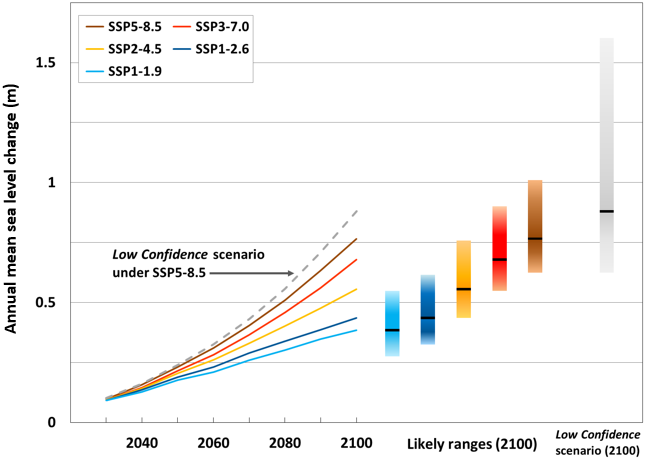
Global mean sea level will continue to rise over the 21st century. Relative to 1995-2014, the likely global mean sea level rise by 2100 is 0.28-0.55 m, 0.44-0.76 m and 0.63-1.01 m under the very low (SSP1-1.9), intermediate (SSP2-4.5) and very high (SSP5-8.5) greenhouse gas emissions scenarios respectively. To indicate the potential impact of deeply uncertain ice sheet processes, a Low Confidence scenario under SSP5-8.5 is also considered by IPCC. In the longer term, sea level is committed to rise for centuries to millennia due to continuing deep ocean warming and ice sheet melt.
Global mean sea level change relative to 1995-2014. Coloured solid curves and the grey broken curve show median projections under the 5 emissions scenarios and the SSP5-8.5 Low Confidence scenario respectively. Black horizontal lines indicate median projections (2100). Coloured bars indicate likely ranges (2100) under the 5 emissions scenarios. The probability for the likely range to cover the outcome is at least 66%. The grey bar indicates the 17th-83rd percentile range of projection (2100) under the SSP5-8.5 Low Confidence scenario. (Data source: IPCC AR6)
| |||||||||||||||||||||||||||||||||||||||||||||||||||||||
|
Data source:
|
