The Weather of January 2017
2 February 2017
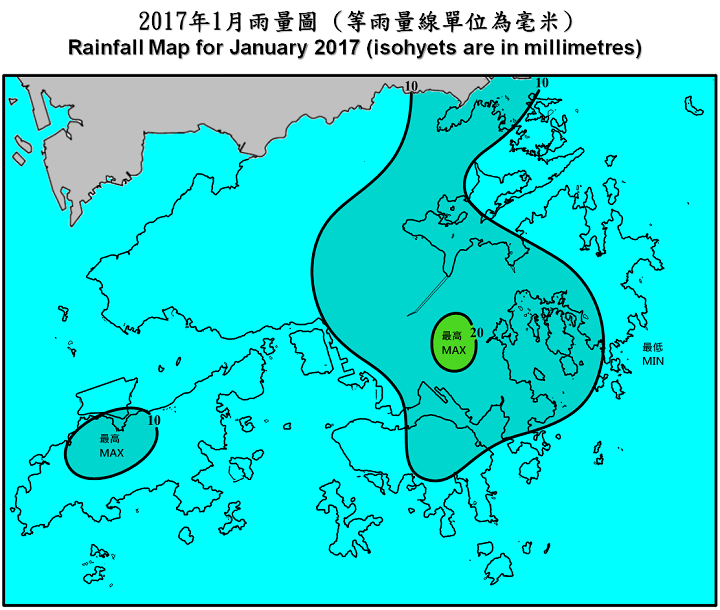
With no significant cold surge affecting the coastal areas of Guangdong, January 2017 became the warmest January in Hong Kong with record-breaking monthly mean temperature of 18.5 degrees and monthly mean minimum temperature of 17.0 degrees, 2.2 degrees and 2.5 degrees above their respective normals. The month was drier than usual in terms of rainfall amount with only 7.8 millimetres in total, less than one-third of the normal of 24.7 millimetres for January.
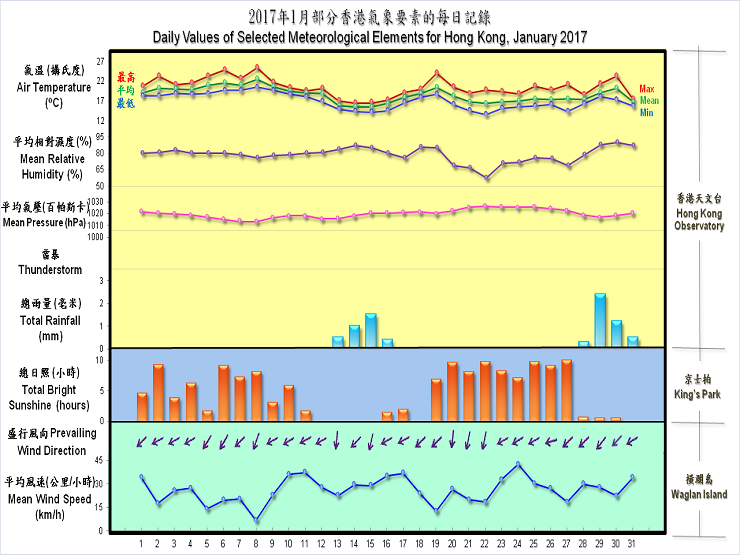
Under the influence of an easterly maritime airstream, the weather in Hong Kong was mild with a mixture of sunshine and cloudy episodes for the first five days in the month. The weather turned generally fine on 6 January and with abundant sunshine over the next couple of days, temperatures at the Hong Kong Observatory rose to a maximum of 25.5 degrees on 8 January, the highest of the month. The arrival of a replenishment of the northeast monsoon that night brought cloudier and slightly cooler weather in the next two days.
With a strengthening easterly airstream and cloud bands associated with a low pressure area over the South China Sea moving in towards the coastal areas of Guangdong, a spell of cloudy and misty weather set in over the territory on 11 January. As replenishments of the northeast monsoon reached the south China coast under an overcast sky, local weather turned progressively cooler with rain patches on 12 - 16 January. With the northeast monsoon moderating gradually and the weather warming up again, the lingering cloud bands started to dissipate and gave way to mainly fine weather on 19 January.
Following the arrival of a significant replenishment of the northeast monsoon, northerly winds of continental origin brought dry and cooler weather to Hong Kong on 20 - 22 January. Under clear skies, temperatures at the Hong Kong Observatory fell to a minimum of 13.6 degrees on the morning of 22 January, the lowest of the month. With relative humidity falling below 40 percent during the day over a sunny weekend, hill fires were reported in Siu Lek Yuen of Sha Tin. Despite a strengthening easterly airstream on 24 January, fine weather persisted on 23-27 January. Affected by a moist easterly airstream, local weather became cloudy on 28 January with rain patches and poor visibility in some areas over the Chinese New Year holiday period. It also turned appreciably cooler by the end of the month as a fresh to strong easterly airstream brought a replenishment of the northeast monsoon to the south China coastal areas on the night of 30 January.
One tropical cyclone occurred over the South China Sea and the western North Pacific in the month.
Details of issuance and cancellation of various warnings/signals in the month are summarized in Tables 1.1 to 1.3. Monthly meteorological figures and departures from normal for January are tabulated in Table 2.
Warnings and Signals issued in January 2017
| Beginning Time | Ending Time | ||
|---|---|---|---|
| Day/Month | HKT | Day/Month | HKT |
| 24 / 1 | 0200 | 24 / 1 | 0745 |
| 24 / 1 | 2325 | 25 / 1 | 0615 |
| 30 / 1 | 2200 | 31 / 1 | 0845 |
| Colour | Beginning Time | Ending Time | ||
|---|---|---|---|---|
| Day/Month | HKT | Day/Month | HKT | |
| Yellow | 1 / 1 | 0600 | 1 / 1 | 1800 |
| Yellow | 2 / 1 | 0600 | 2 / 1 | 1800 |
| Yellow | 8 / 1 | 0600 | 8 / 1 | 1800 |
| Red | 21 / 1 | 0600 | 22 / 1 | 2130 |
| Red | 27 / 1 | 1145 | 27 / 1 | 1945 |
| Yellow | 28 / 1 | 0745 | 28 / 1 | 1300 |
| Beginning Time | Ending Time | ||
|---|---|---|---|
| Day/Month | HKT | Day/Month | HKT |
| 21 / 1 | 1620 | 22 / 1 | 0945 |
| Meteorological Element | Figure of the Month | Departure from Normal* |
|---|---|---|
| Mean Daily Maximum Air Temperature | 20.6 degrees C | 2.0 degrees above normal |
| Mean Air Temperature | 18.5 degrees C | 2.2 degrees above normal |
| Mean Daily Minimum Air Temperature | 17.0 degrees C | 2.5 degrees above normal |
| Mean Dew Point Temperature | 14.7 degrees C | 3.3 degrees above normal |
| Mean Relative Humidity | 79 % | 5 % above normal |
| Mean Cloud Amount | 66 % | 5 % above normal |
| Total Rainfall | 7.8 mm | 16.9 mm below normal |
| Number of hours of Reduced VisibilityΔ | 81 hours | 158.8 hours below normal§ |
| Total Bright Sunshine Duration | 145.1 hours | 2.1 hours above normal |
| Mean Daily Global Solar Radiation | 11.10 Megajoule / square metre | 0.93 Megajoule above normal |
| Total Evaporation | 59.4 mm | 11.9 mm below normal |
| Remarks : | All measurements were made at the Hong Kong Observatory except sunshine,
solar radiation and evaporation which were recorded at King's Park
Meteorological Station and visibility which was observed at the Hong
Kong International Airport. |
| Δ | The visibility readings at the Hong Kong International Airport are based on hourly observations by professional meteorological observers in 2004 and before, and average readings over the 10-minute period before the clock hour of the visibility meter near the middle of the south runway from 2005 onwards. The change of the data source in 2005 is an improvement of the visibility assessment using instrumented observations following the international trend.
|
* Departure from 1981 - 2010 climatological normal, except for number of hours of reduced visibility |
|
§ Departure from mean value between 1997 and 2016 |
|
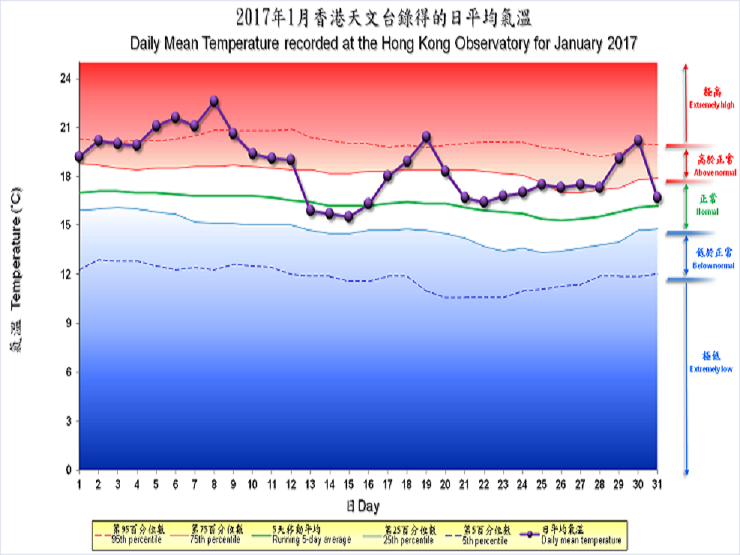
| Remarks : | Extremely high: above 95th percentile Above normal: between 75th and 95th percentile Normal: between 25th and 75th percentile Below normal: between 5th and 25th percentile Extremely low: below 5th percentile Percentile and 5-day running average values are computed based on the data from 1981 to 2010 |